[1] -0.354Data Analysis for LEL - Week 6
Data summaries
University of Edinburgh

Summary measures

Summary measures
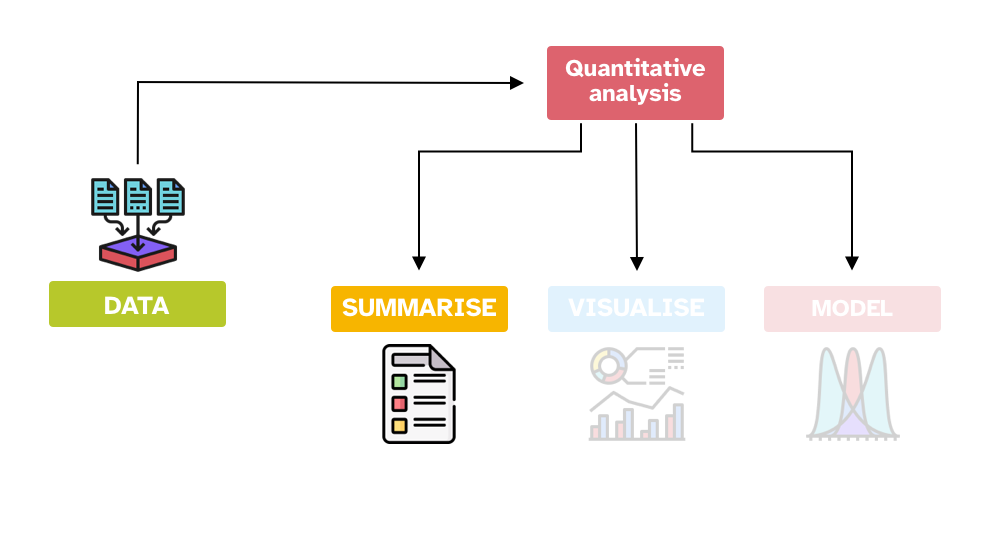
We can summarise variables using summary measures.
There are two types of summary measures.
Measures of central tendency
- Measures of central tendency indicate the typical or central value of a sample.
Measures of dispersion
- Measures of dispersion indicate the spread or dispersion of the sample values around the central tendency value.
Always report a measure of central tendency together with its measure of dispersion!
Measures of central tendency
Mean
\[\bar{x} = \frac{\sum_{i=1}^{n} x_i}{n} = \frac{x_1 + ... + x_n}{n}\]
Median
\[\text{if } n \text{ is odd, } x_\frac{n+1}{2}\]
\[\text{if } n \text{ is even, } \frac{x_\frac{n}{2} + x_\frac{n}{2}}{2}\]
Mode
The most common value.
Measures of dispersion
Minimum and maximum values
Range
\[ max(x) - min(x)\]
The difference between the largest and smallest value.
Standard deviation
\[\text{SD} = \sqrt{\frac{\sum_{i=1}^n (x_i - \bar{x})^2}{n-1}} = \sqrt{\frac{(x_1 - \bar{x})^2 + ... + (x_n - \bar{x})^2}{n-1}}\]
Mean
Use the mean with numeric continuous variables, if:
- The variable can take on any positive and negative number, including 0.
- The variable can take on any positive number only.
[1] 1.122Don’t take the mean of proportions and percentages!
Better to calculate the proportion/percentage across the entire data, rather than take the mean of individual proportions/percentages: see this blog post. If you really really have to, use the median.
Median
Use the median with numeric (continuous and discrete) variables.
[1] 0.09[1] -2.10 -1.12 0.09 0.41 0.95[1] 1.09[1] 0.12 0.32 1.09 1.50 2.58Median
[1] 6.5[1] 3 4 6 7 9 15Median
[1] 6.5[1] 7.333333[1] 6.5[1] 11.5Median
The mean is very sensitive to outliers.
The median is not.
Mode
Use the mode with categorical (discrete) variables.
  blue  green    red yellow
     2      1      3      2
The mode is the most frequent value: red.
Likert scales are ordinal (categorical) variables, so the mean and median are not appropriate!
You should use the mode (You can use the median with Likert scales if you really really need to…)
Minimum and maximum
Report minimum and maximum values for any numeric variable.
[1] -2.1[1] 0.95[1] -2.10 0.95Range
Use the range with any numeric variable.
[1] 3.05[1] 2.46[1] 12Standard deviation
Use the standard deviation with numeric continuous variables, if:
- The variable can take on any positive and negative number, including 0.
[1] 1.23658- The variable can take on any positive number only.
[1] 0.9895555Standard deviations are relative and depend on the measurement unit/scale!
–
Don’t use the standard deviation with proportions and percentages!
Summary measures overview

Summary
The sample \(y\) is generated by a (random) variable \(Y\).
A (statistical) variable is any characteristics, number, or quantity that can be measured or counted.
Variables can be numeric or categorical.
- Numeric variables can be continuous or discrete.
- Categorical variables are only discrete.
We operationalise a measure/observation as a numeric or a categorical variable.
We summarise variables using summary measures:
- Measures of central tendency indicate the typical or central value of a sample.
- Measures of dispersion indicate the spread or dispersion of the sample values around the central tendency value.