Data Analysis for LEL - Week 7
Tidy data
Stefano Coretta
University of Edinburgh
Types of data
Tabular (or rectangular) data (like spreadsheets).
Audio and/or video recordings.
Texts or transcripts.
Annotation (ELAN, TextGrids, …).
Images.
Tabular data
- Tabular data is made of rows and columns.
Prefer formats like Comma Separated Values (
.csv) or Tab Separated Values (.tsv) over MS Excel files. For big data, use Parquet files.If you use Excel files, keep one sheet per Excel file! (Don’t have data in multiple sheet within the same Excel file).
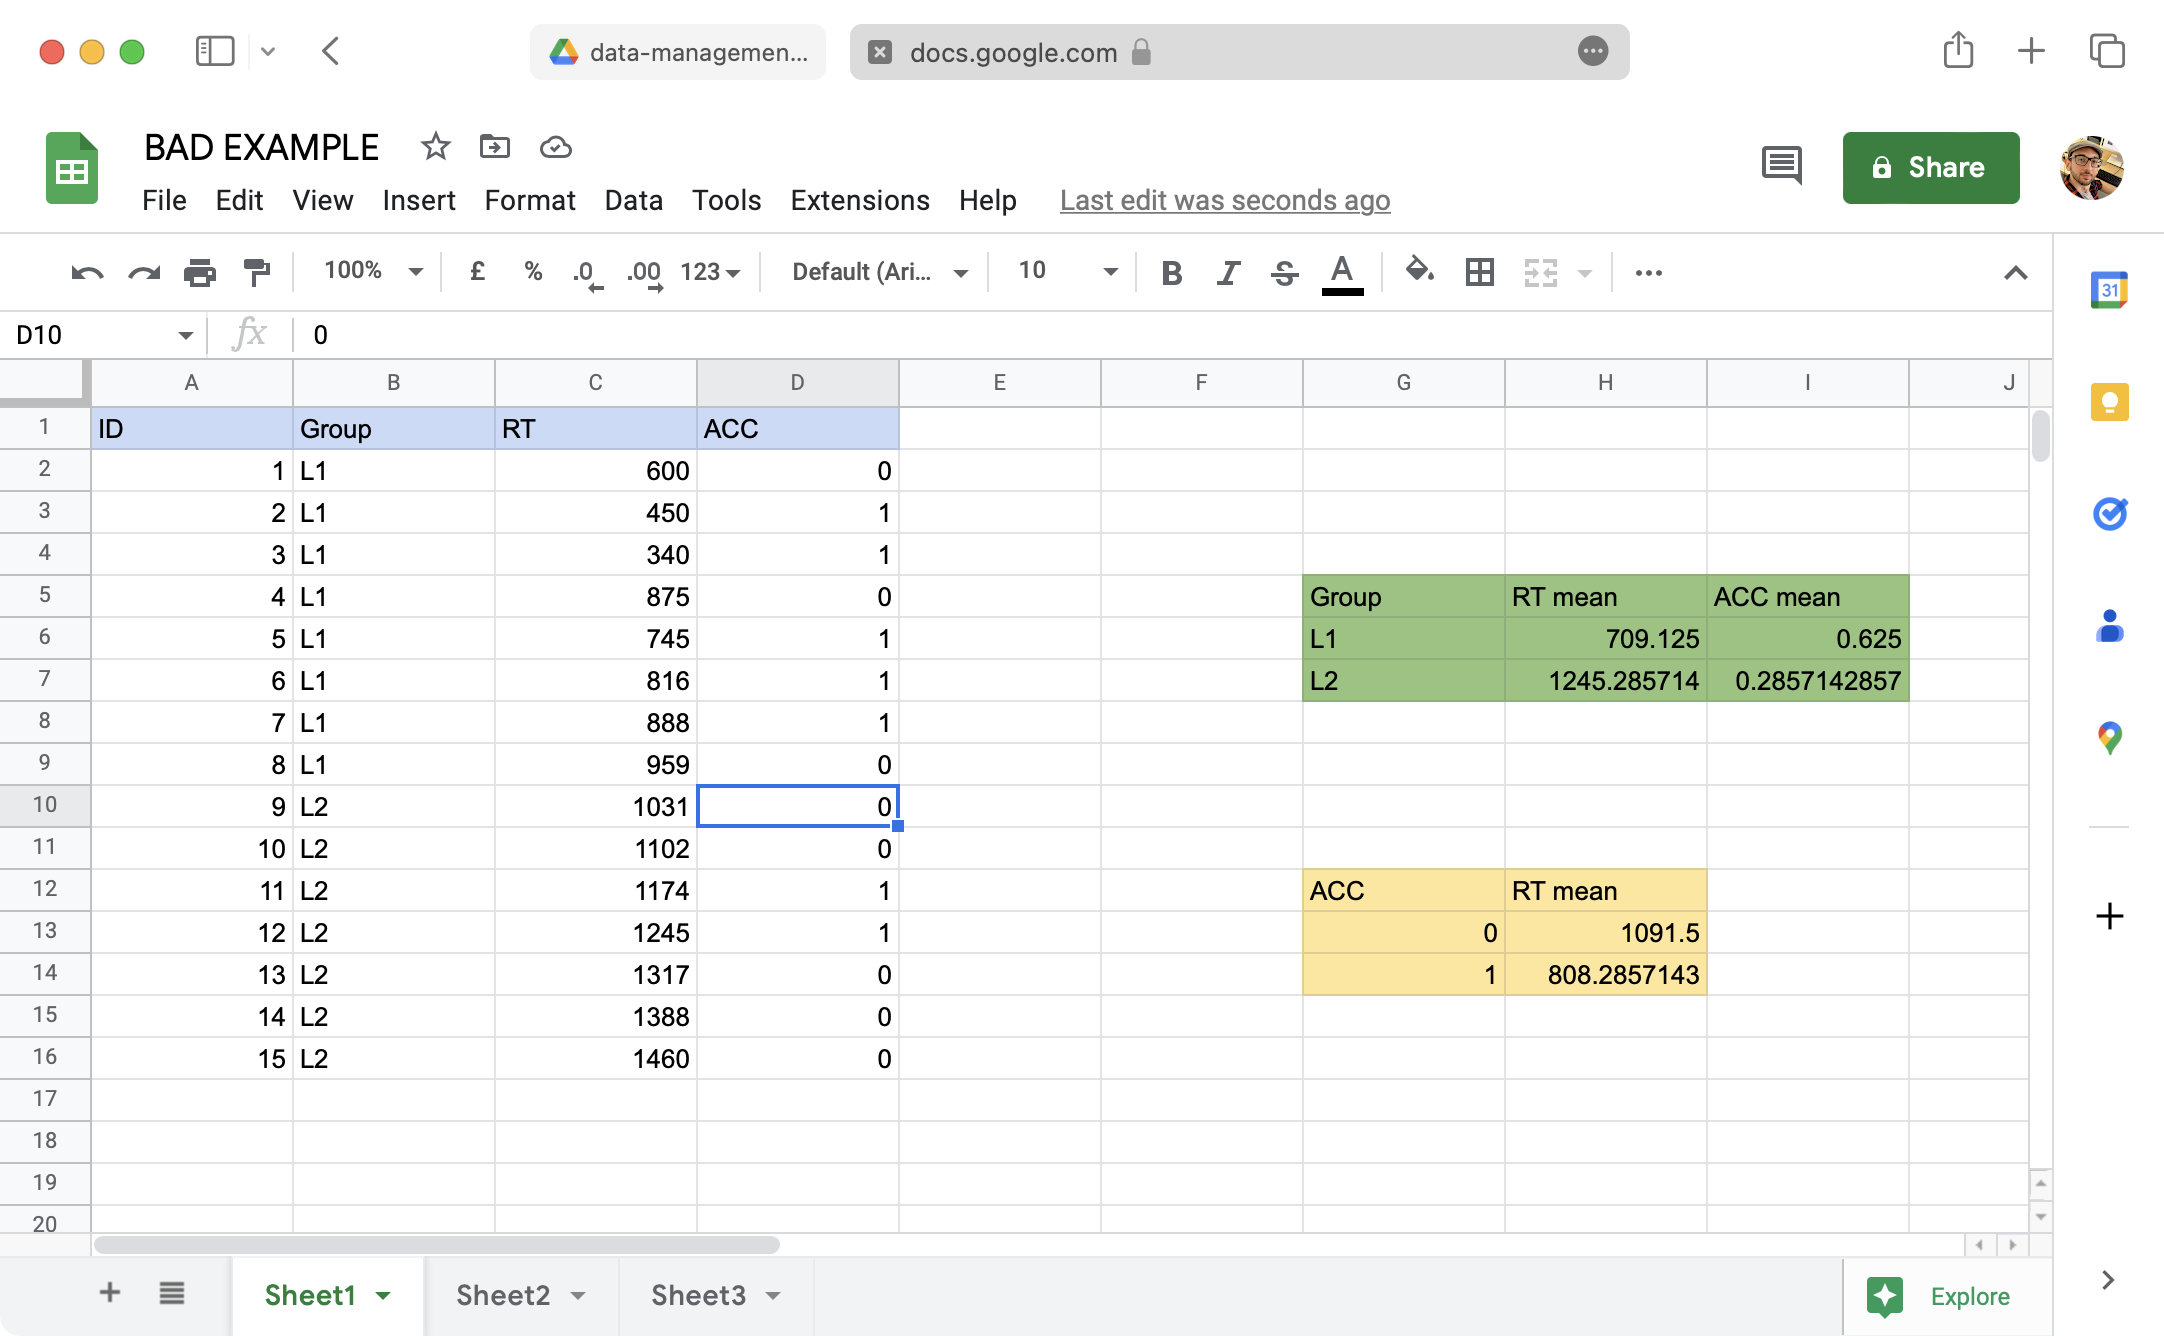
Include ONE TABLE per file. (You can transform and summarise data in R).
Tabular data: DON’T
Coding data
Use explicit coding:
Don’t use colours to code your data! (Software like R will discard colours and any formatting).
Each variable to be coded should have its own column.
Use clear labels:
- ACCURACY: incorrect, correct.
- Not 0, 1.
- DYSLEXIC: dyslexic, non-dyslexic (or control).
- Not 0, 1 or yes, no.
- VOWEL: a, i, u.
- YEAR ABROAD: year_abroad, no_abroad
- Not yes, no.
- ACCURACY: incorrect, correct.
Coding data: DON’T

Coding data: DON’T
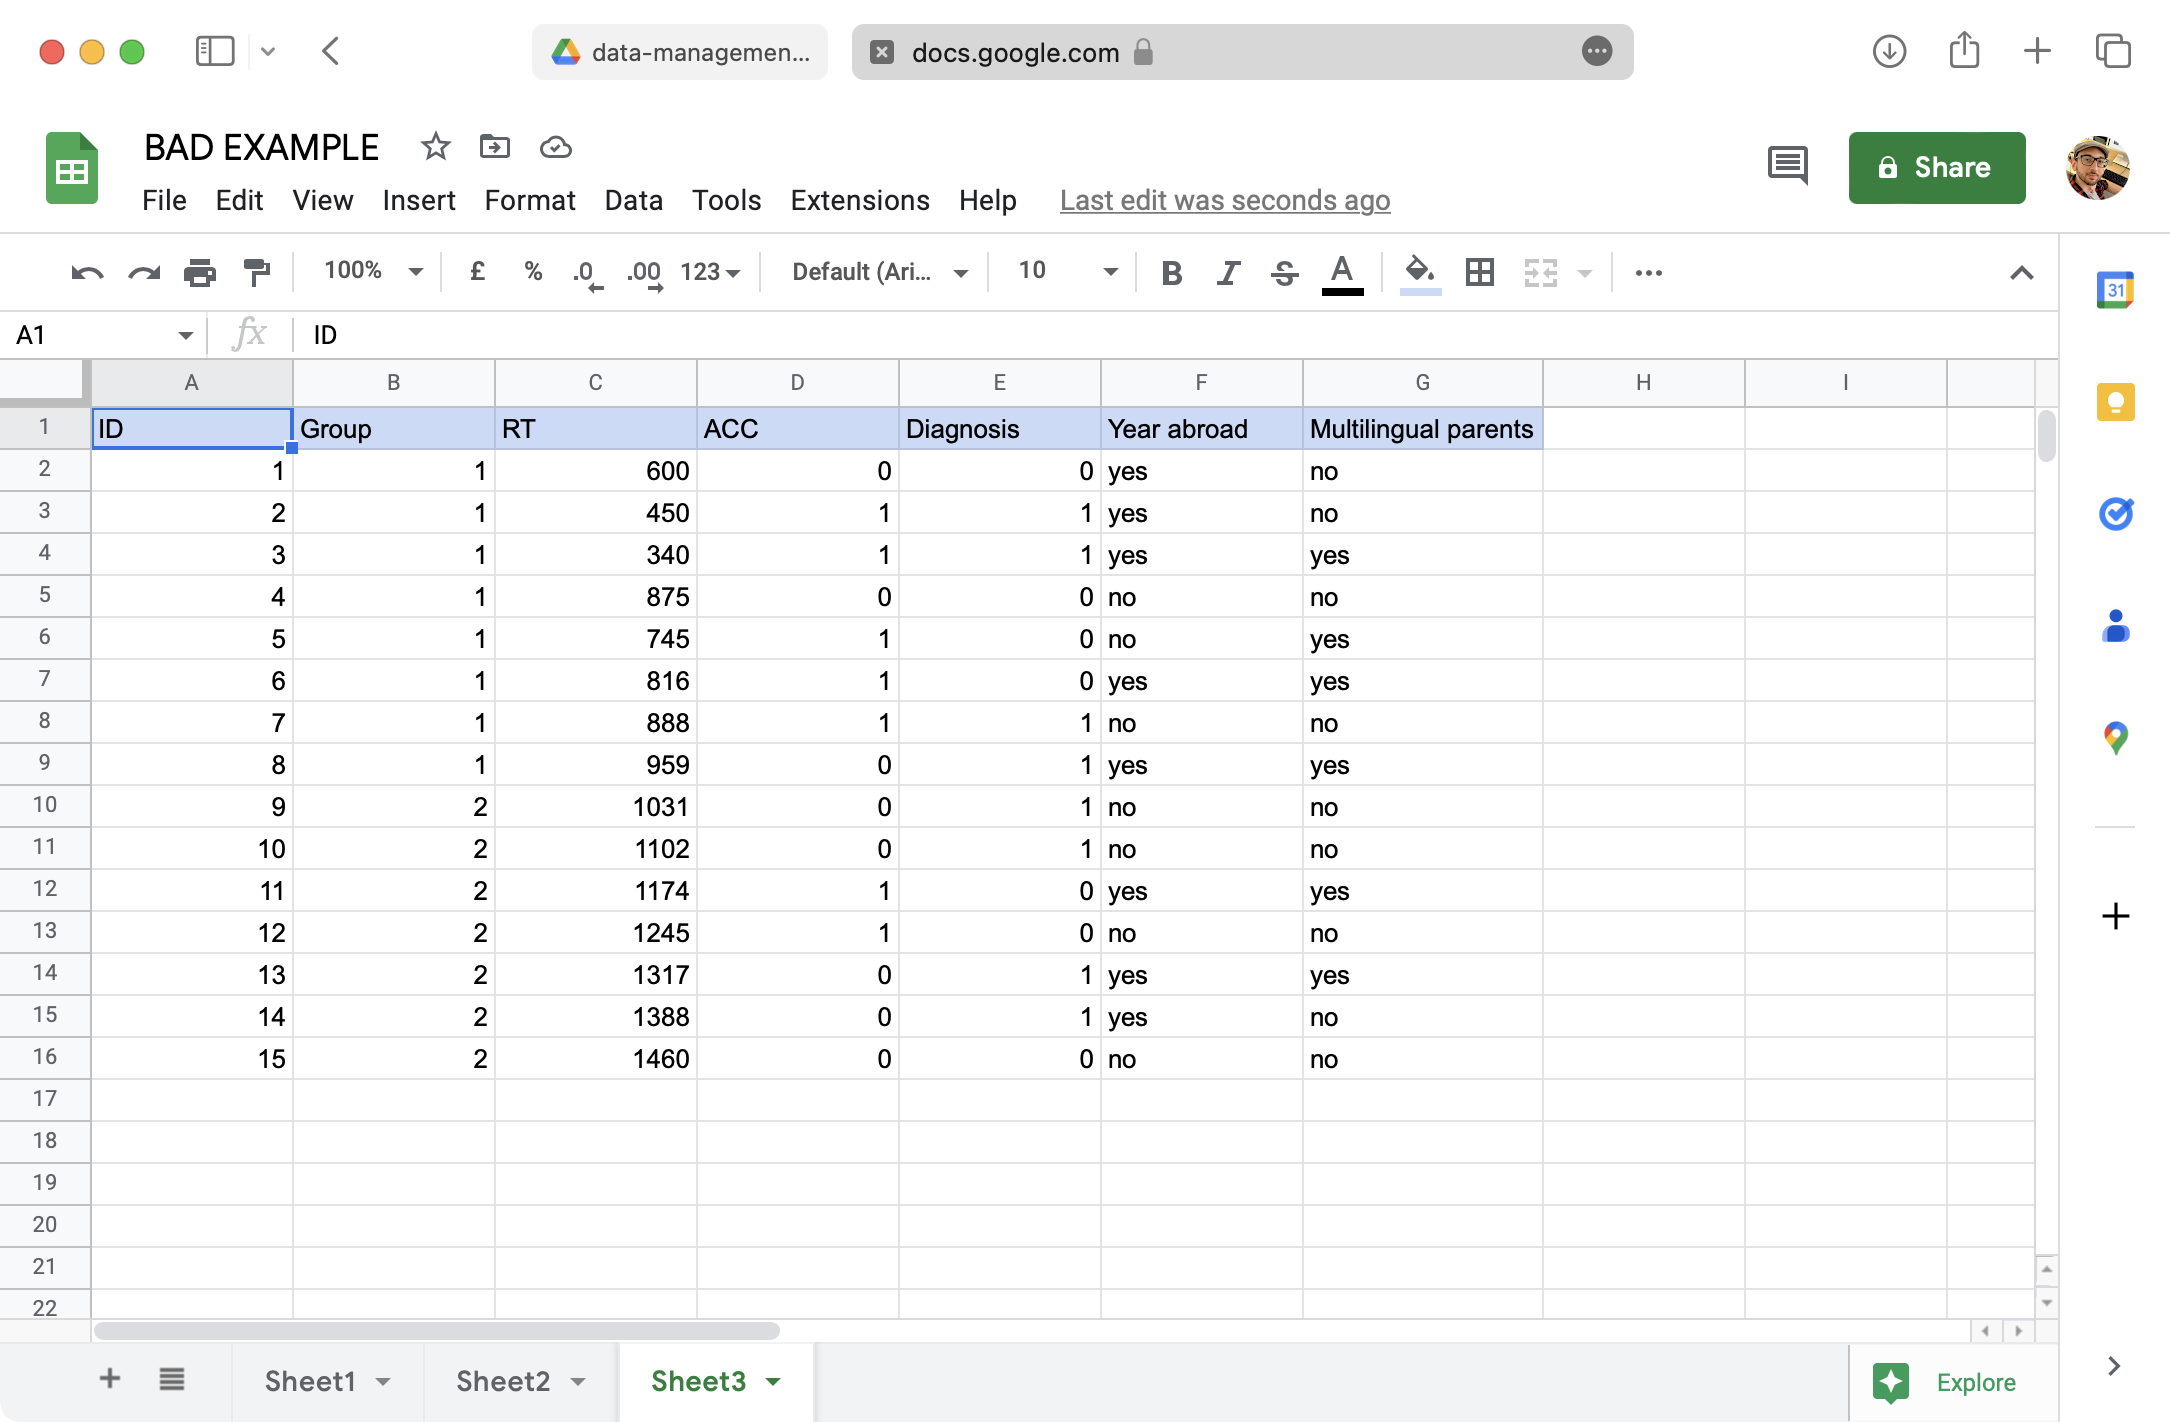
Coding data: DO

Tidy data
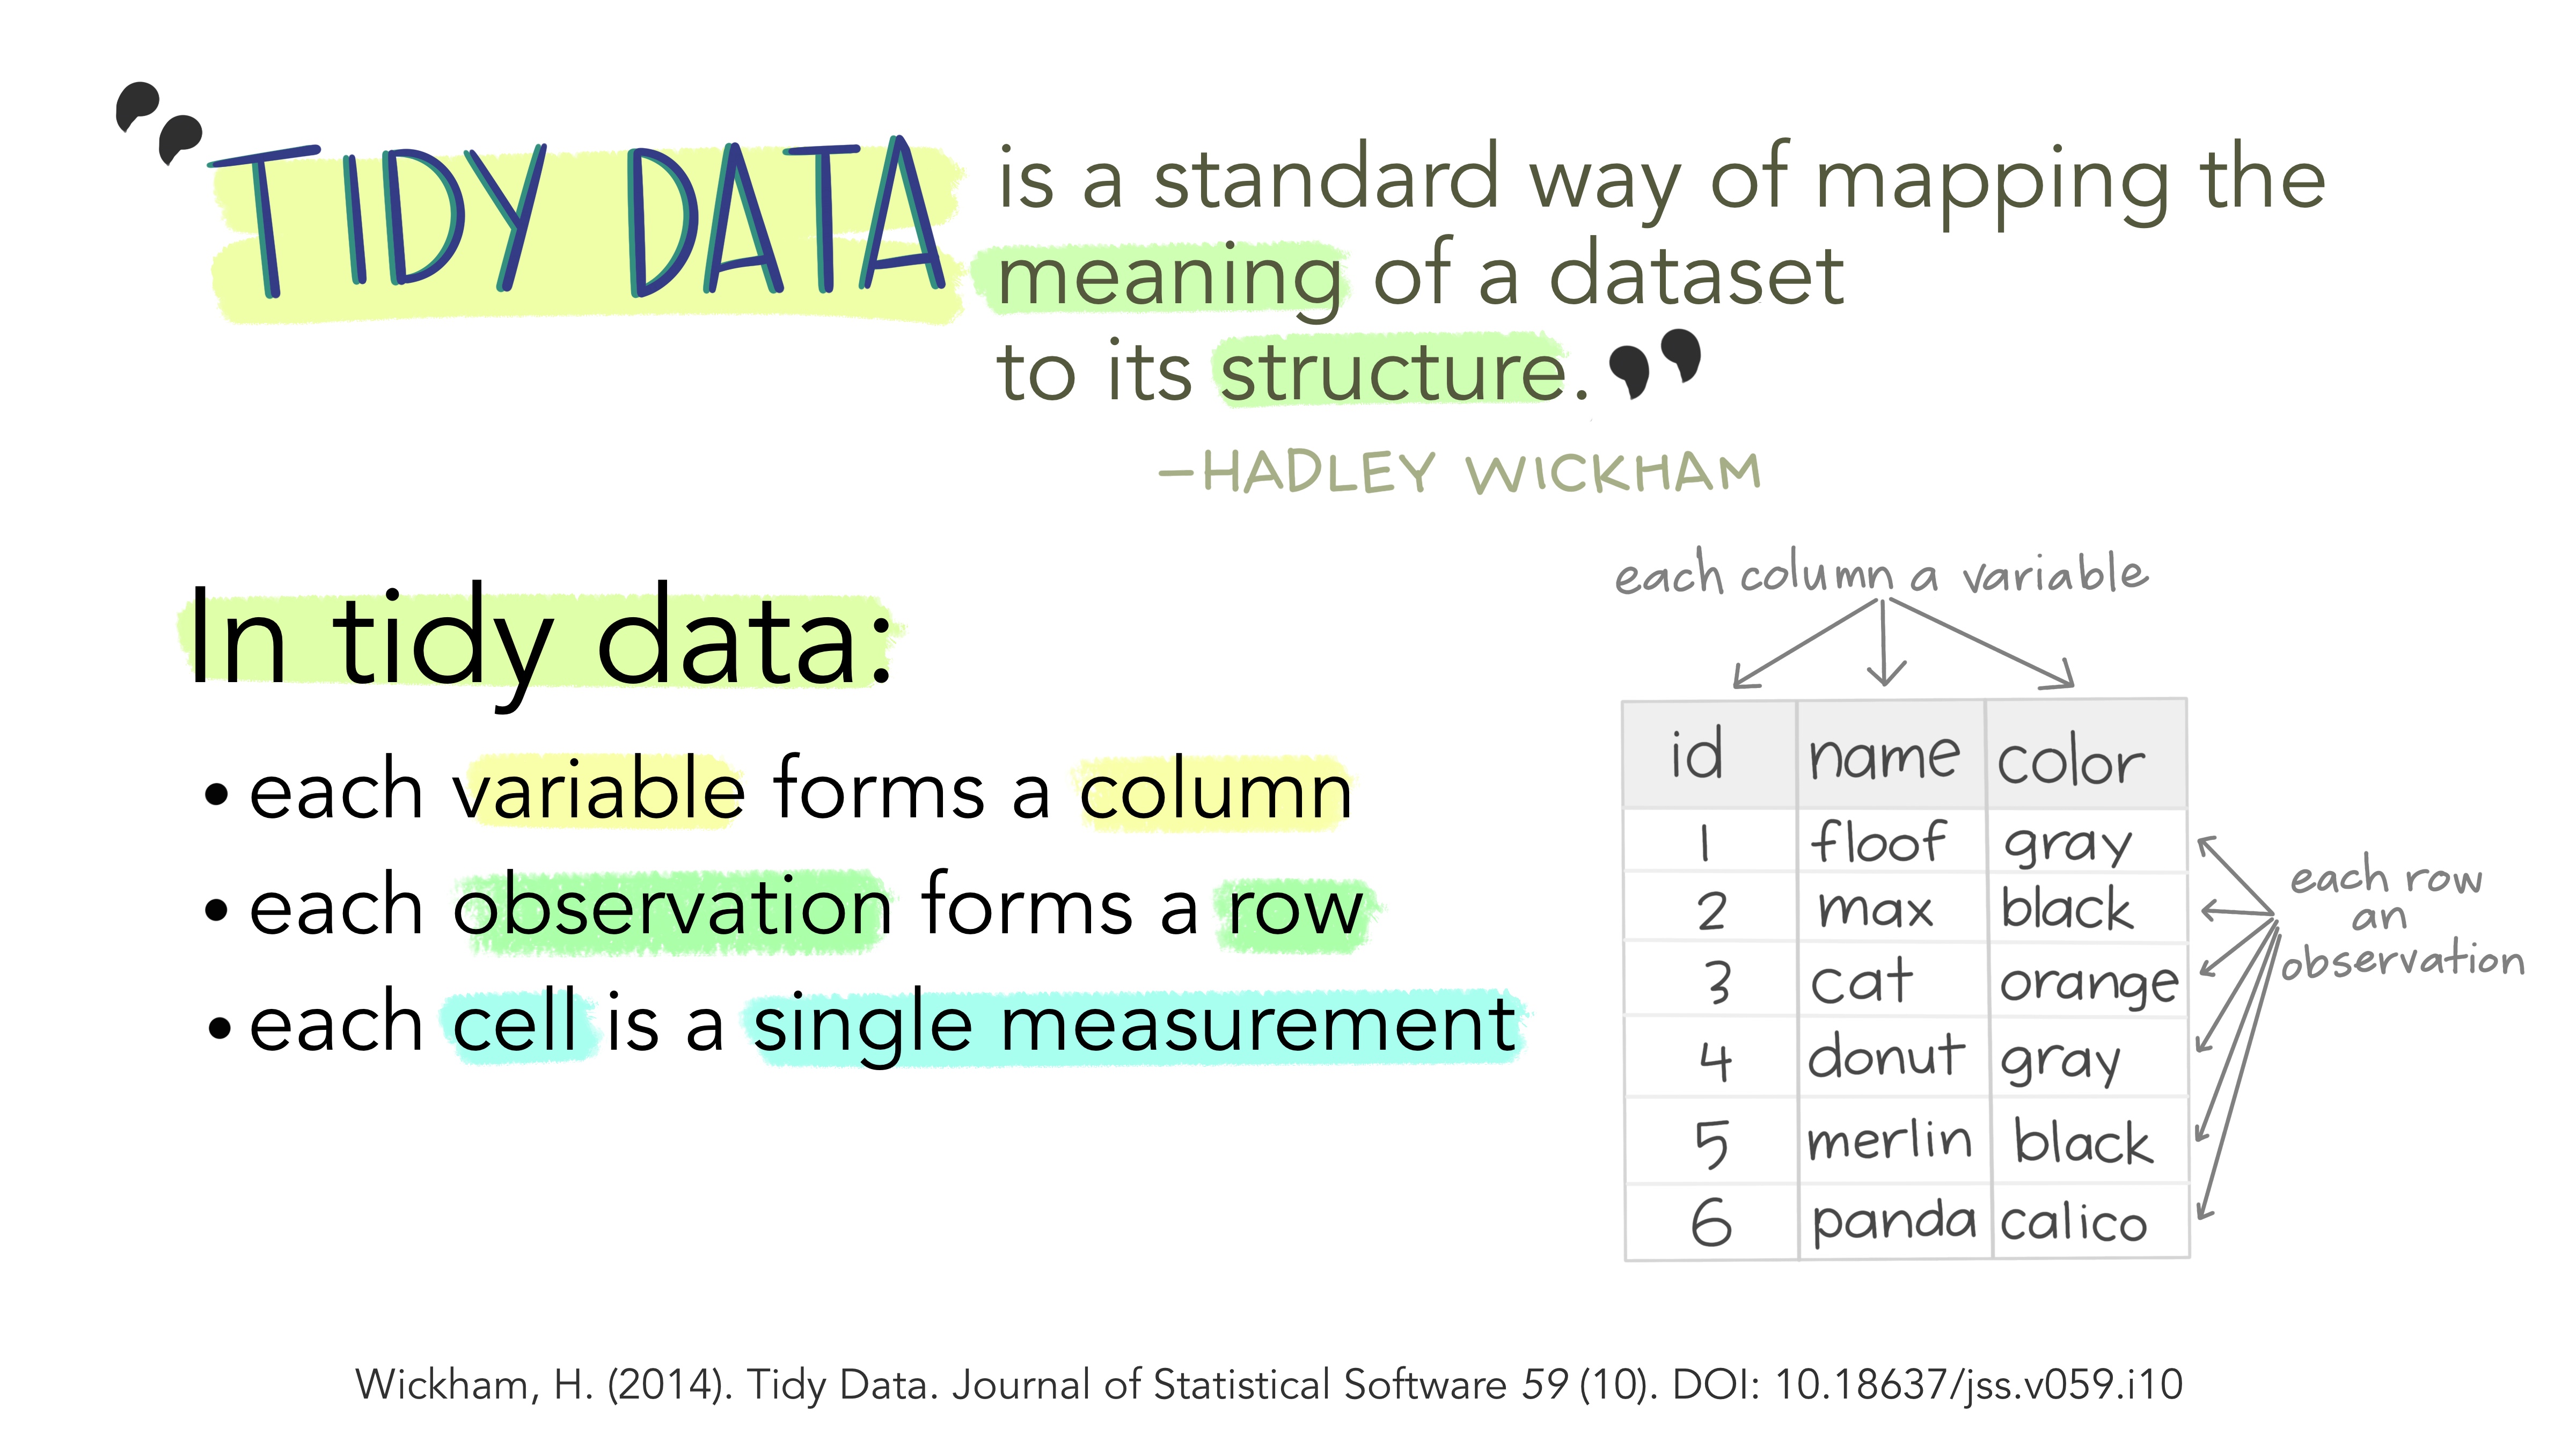
Tidy data
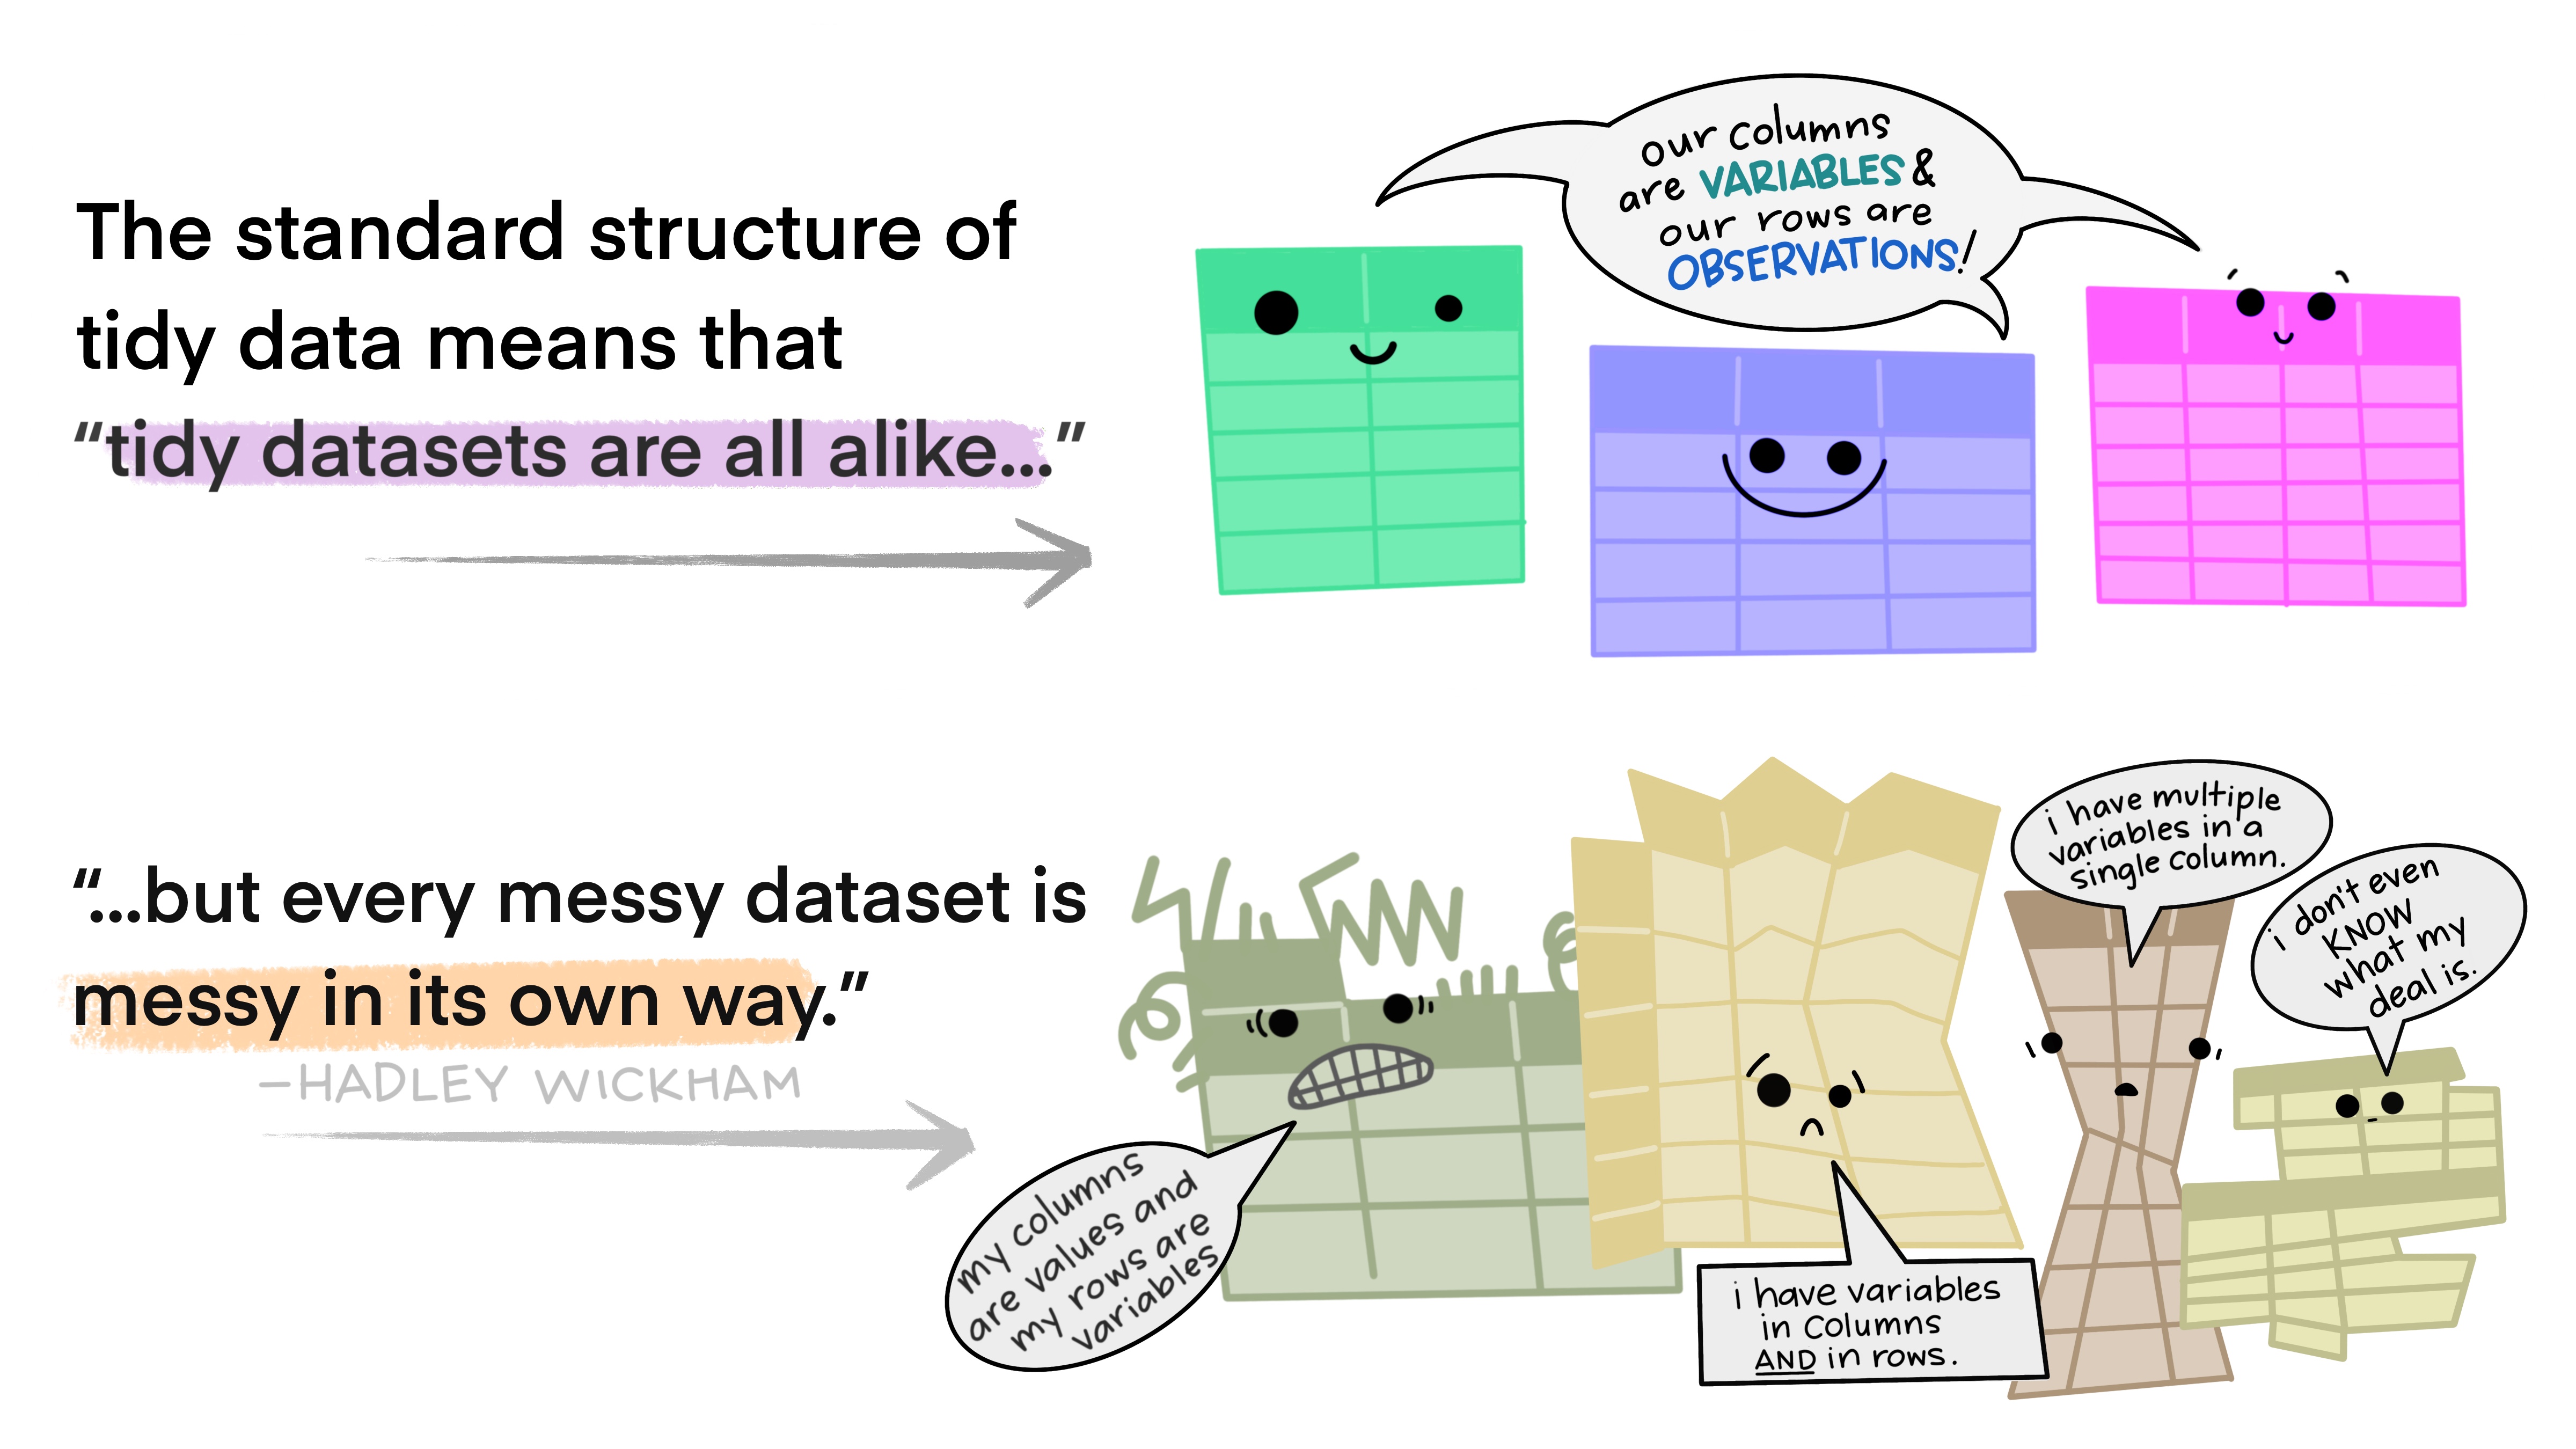
Tidy data: DON’T
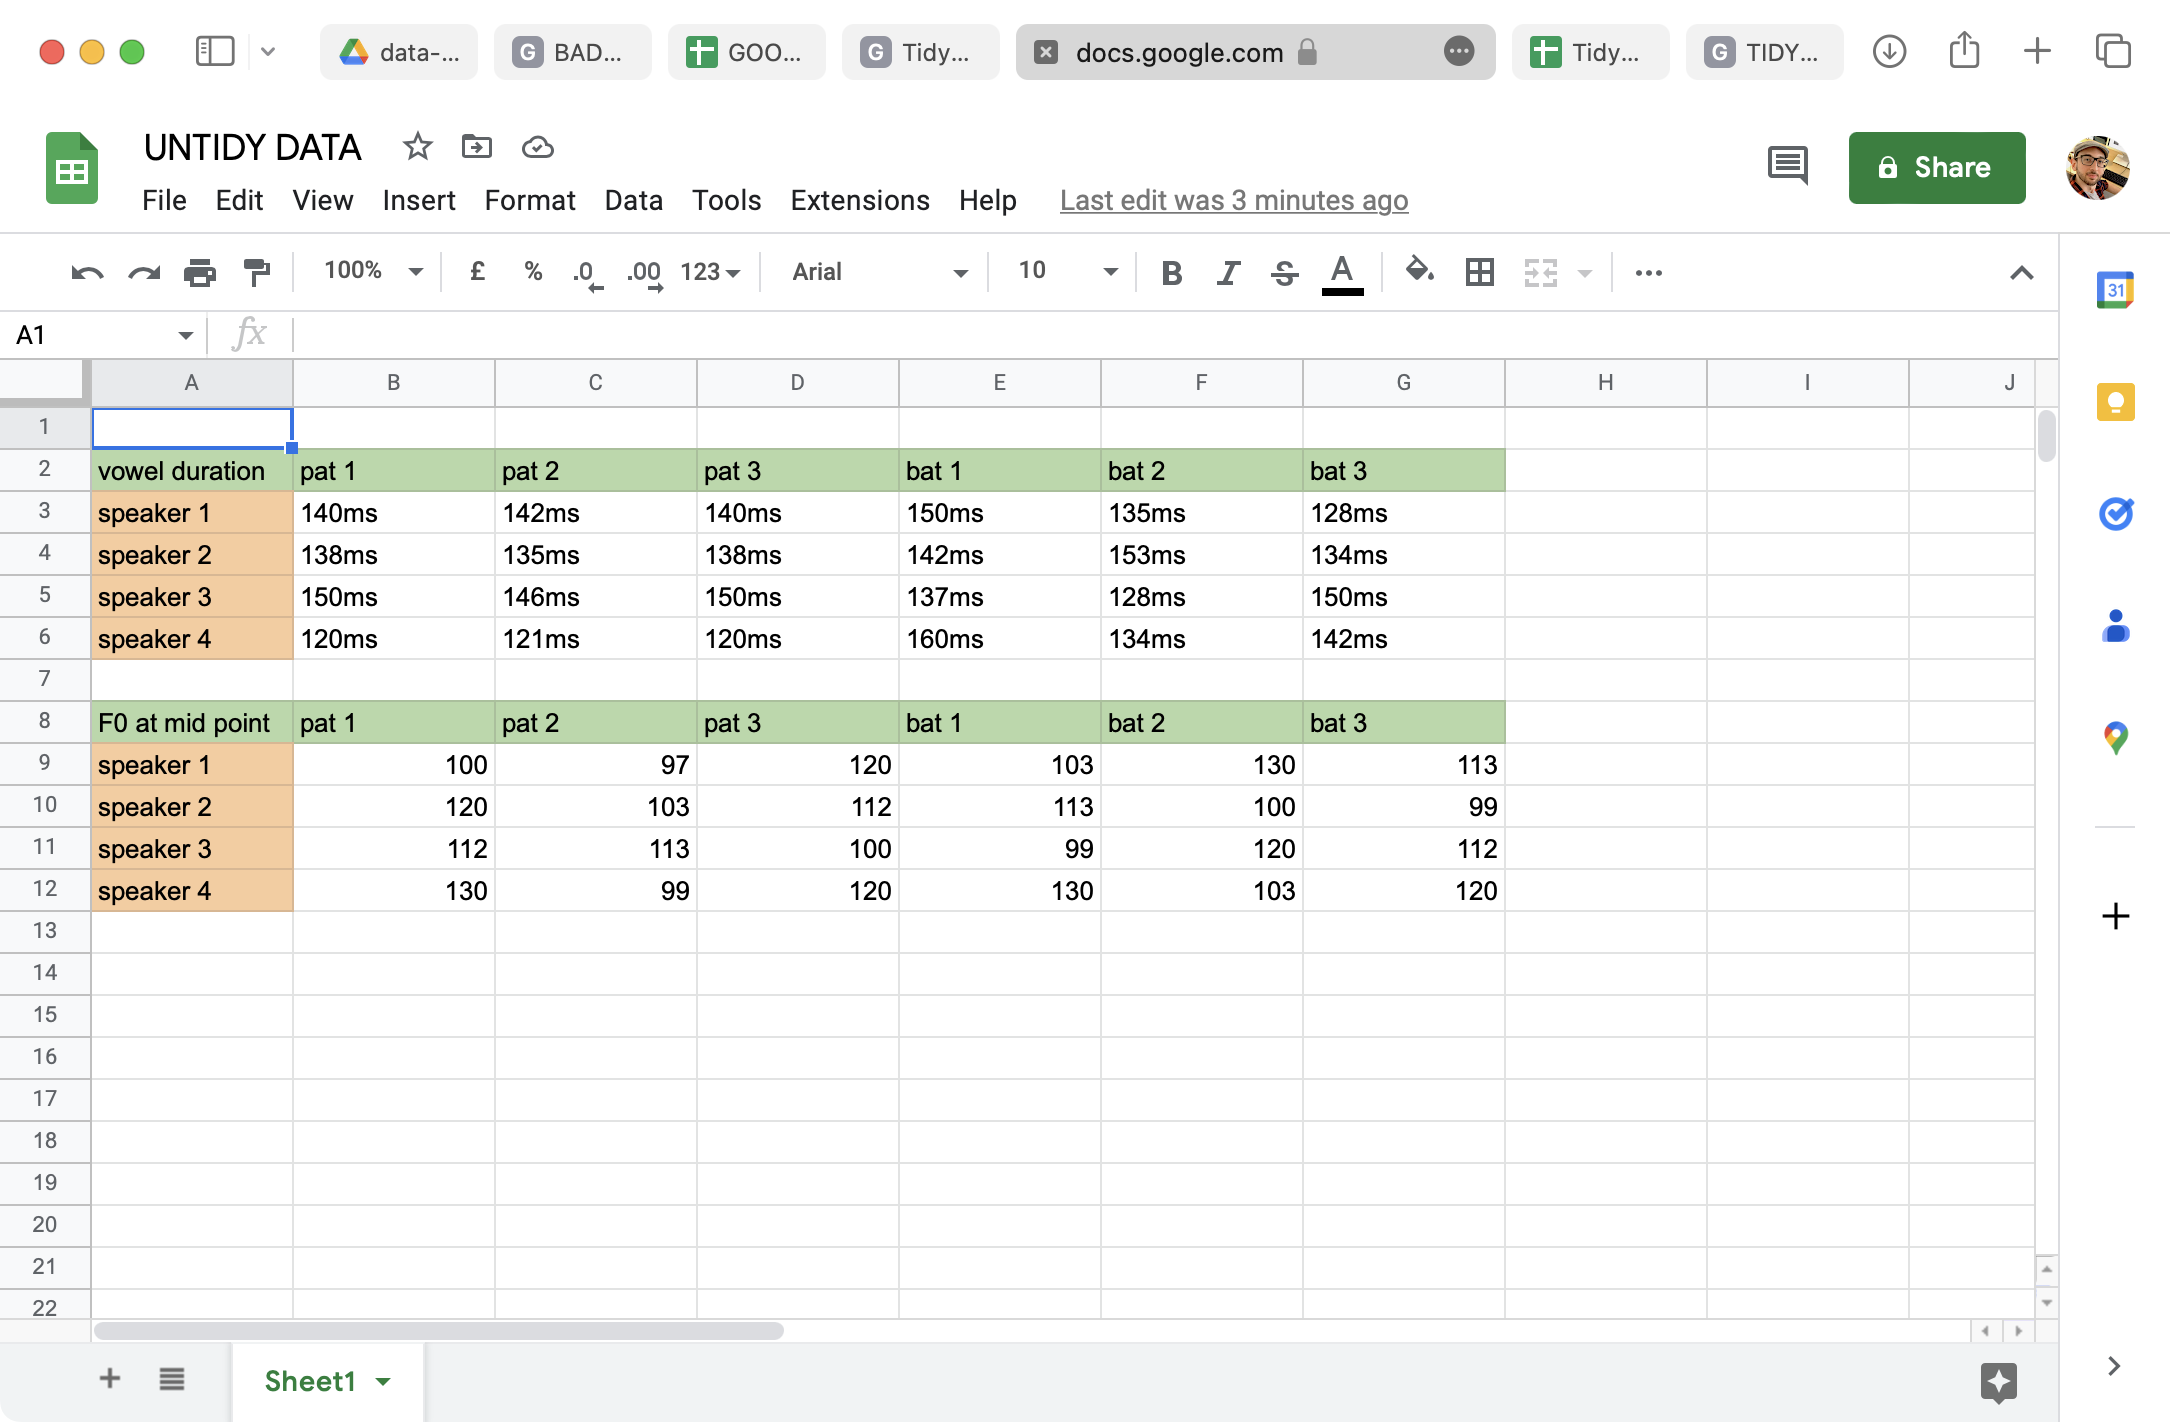
Tidy data: DO

Tidy data: DO
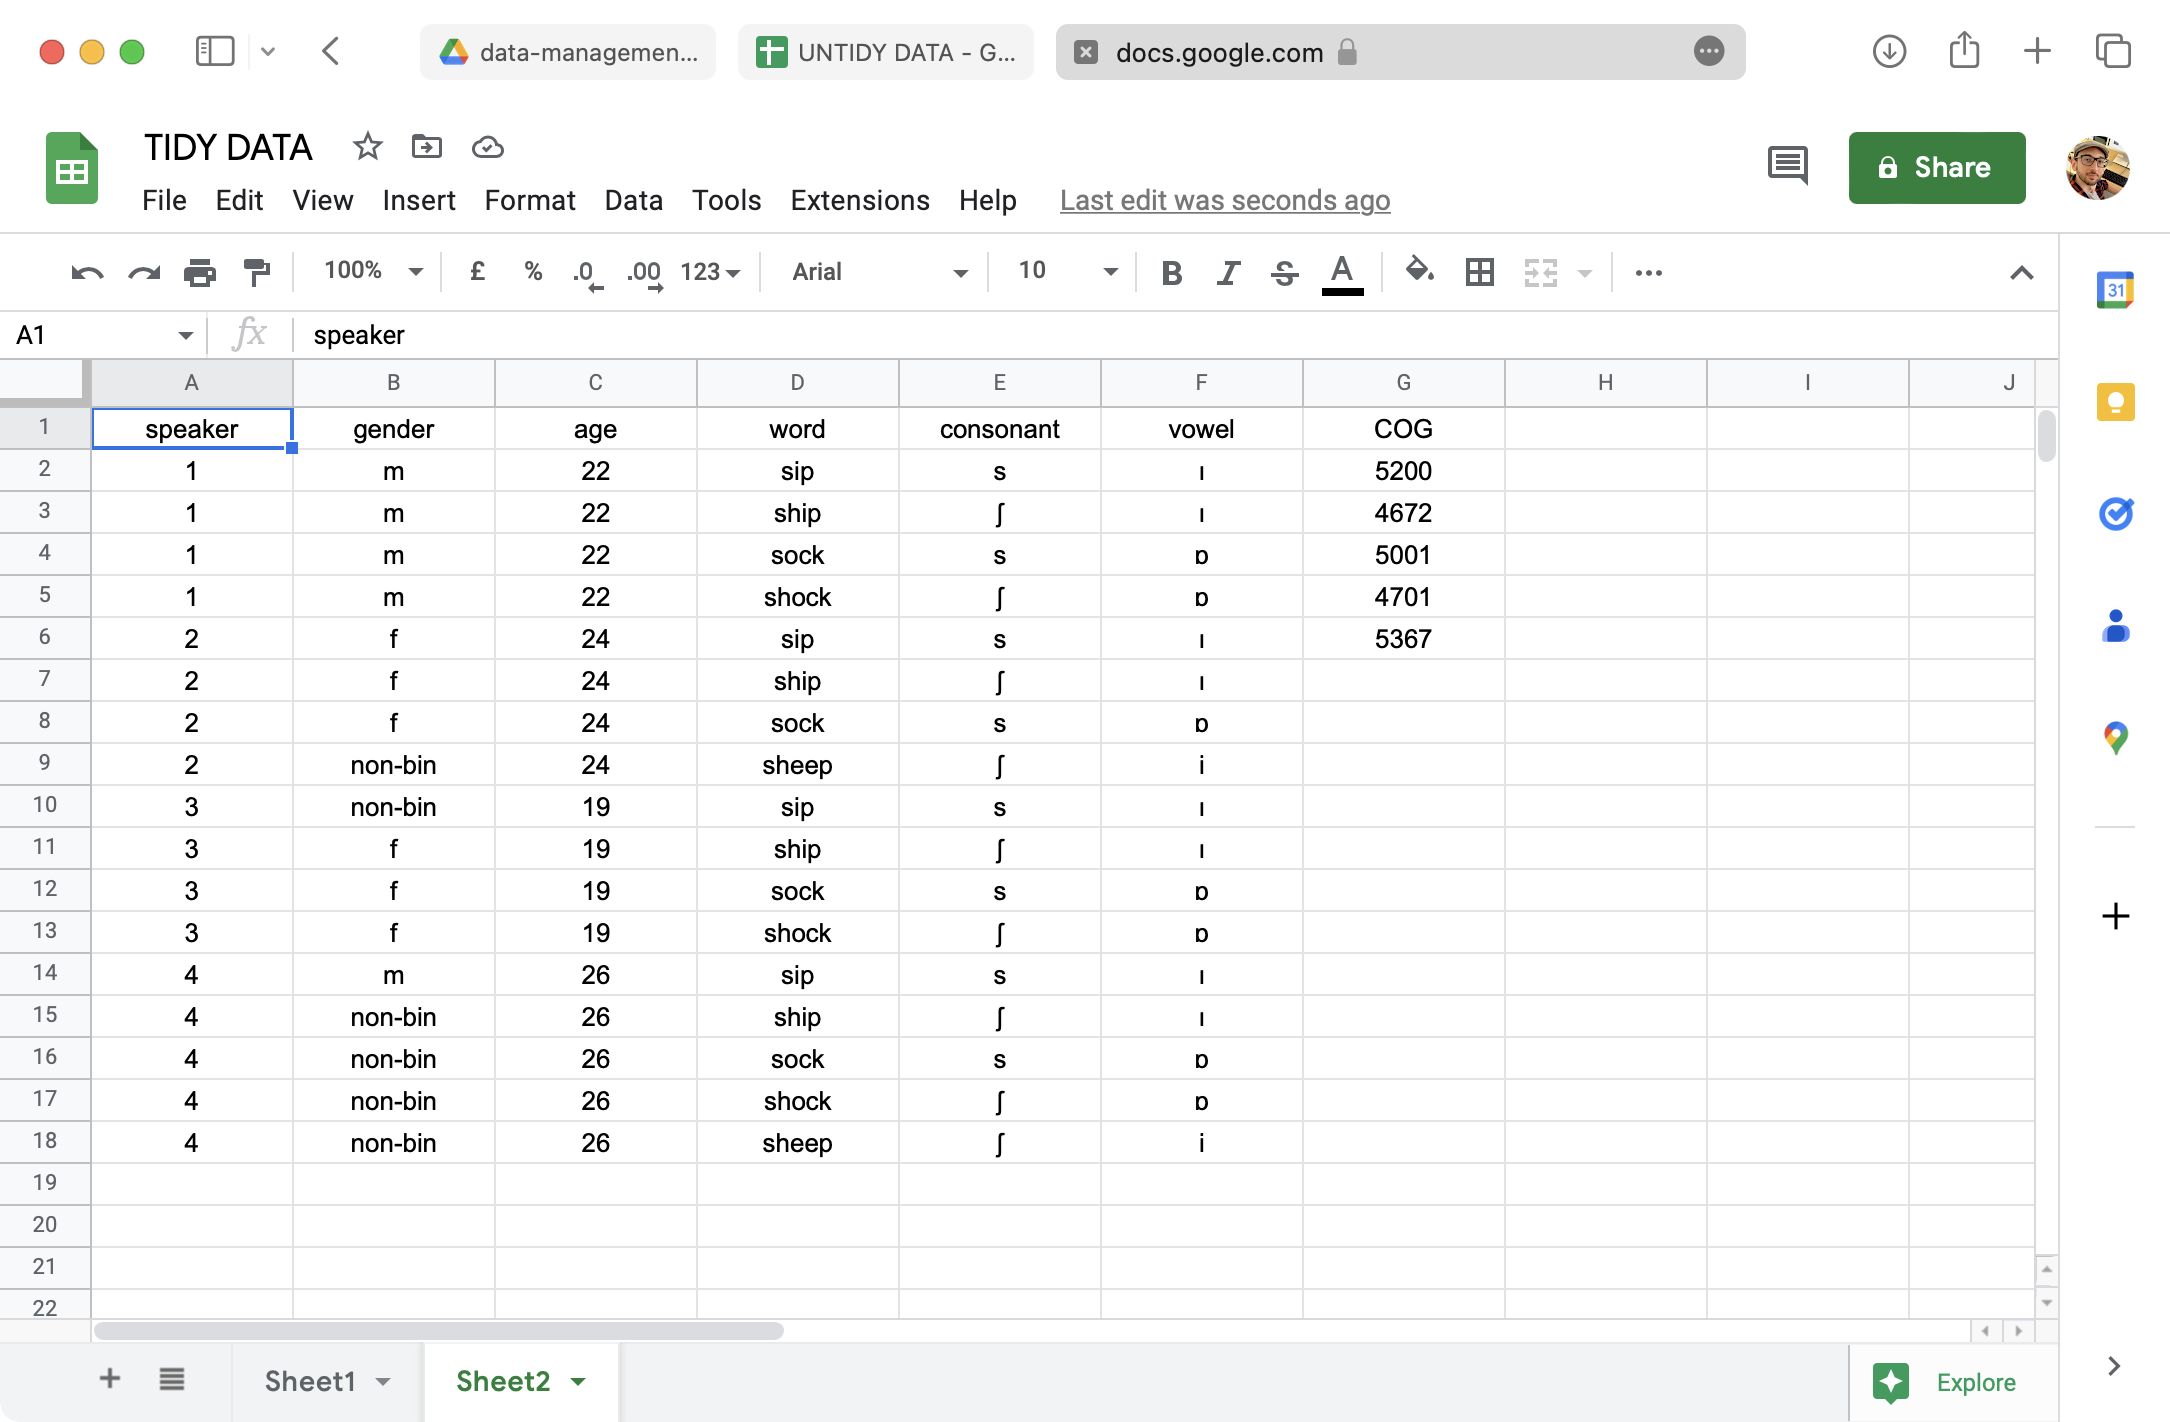
Tidy data: DO
