Research Methods in Developmental Linguistics – Week 5

Dr Stefano Coretta

University of Edinburgh

Case study: Ota 2009

  • Data from Ota 2009.

  • L2 lexical representation of “near-homophones”: ROCK/LOCK for Japanese speakers.

Ota 2009: design

  • Semantic-relatedness task.

  • Pairs of written words presented visually.

    • Homophones: SON/SUN ~ MOON

    • Near-homophones: ROCK/LOCK ~ KEY

    • Minimal pairs: PEAR/BEAR ~ FEAR

Research hypotheses

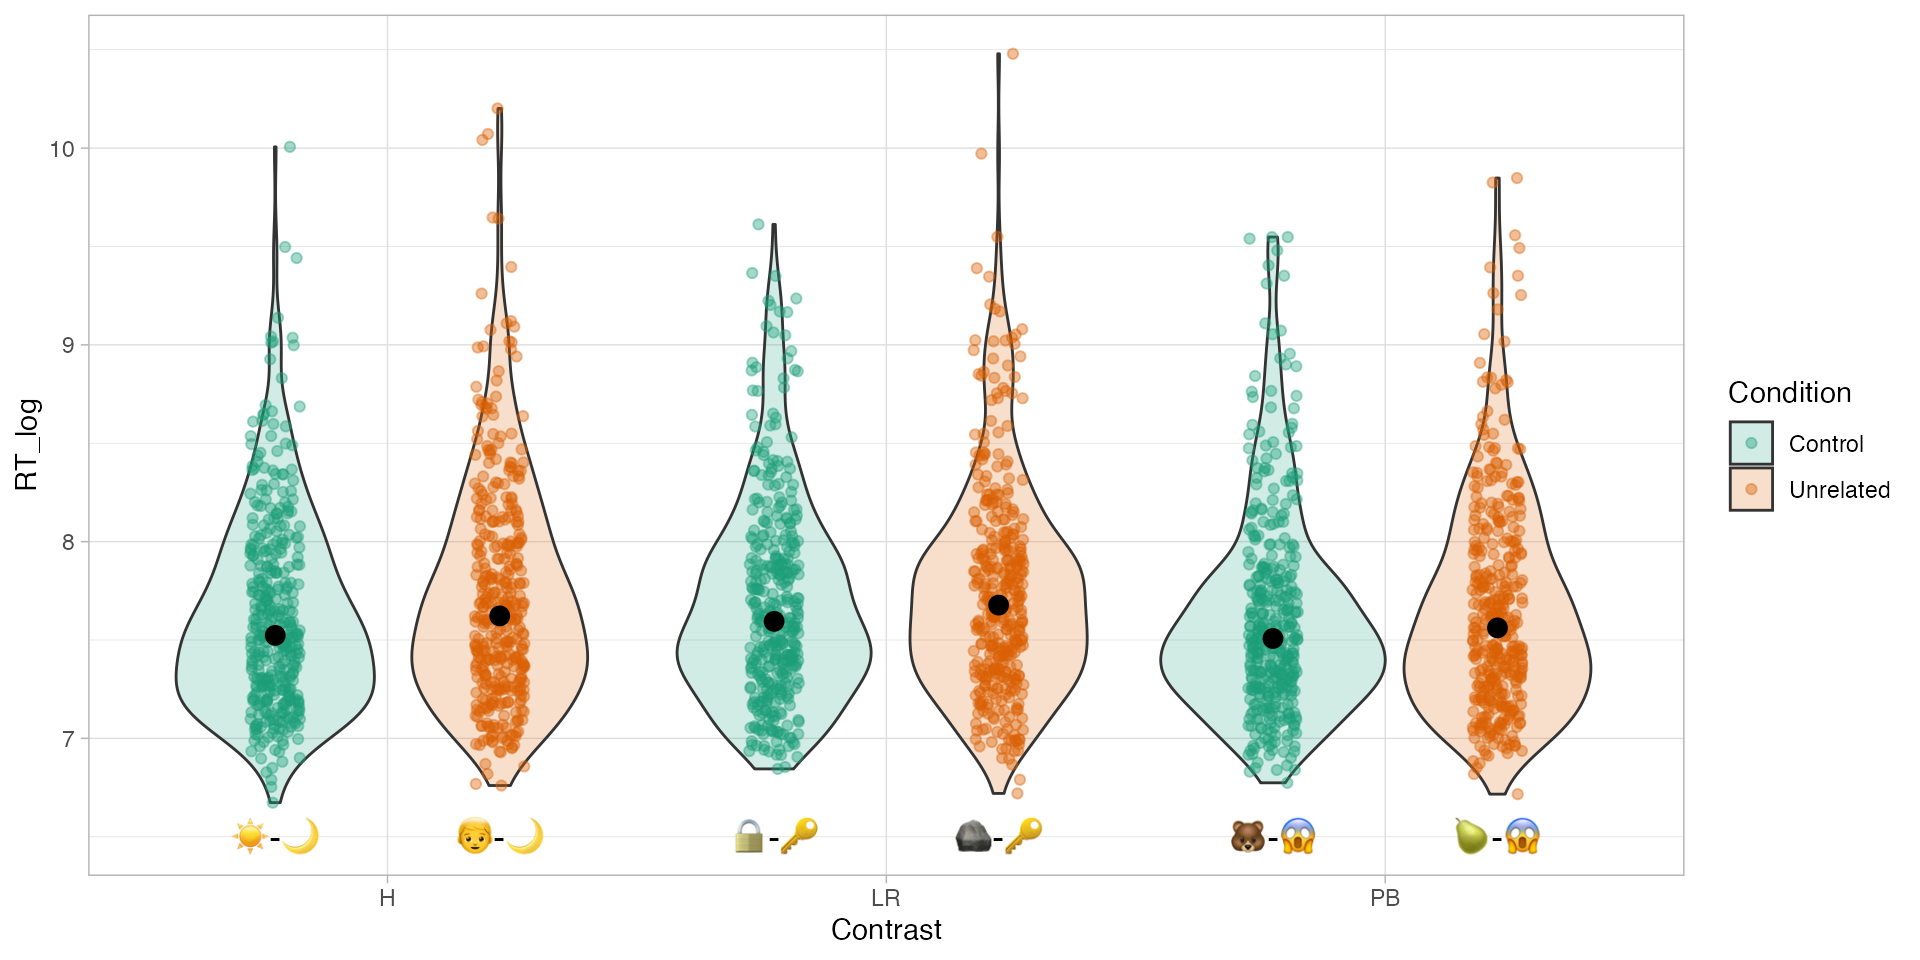
H1. The difference in RTs between unrelated and control is the same in homophones (H) and near-homophones (LR).

H2. There is no difference in RTs in minimal pairs (PB).

Ota 2009: the data

ota2009 <- read_csv("data/ota2009/key-rock.csv") |>
  filter(
    Procedure == "TrialProc", Contrast != "F"
  ) |>
  mutate(
    Subject = as.factor(Subject),
    RT_log = log(Words.RT),
    Item_id = paste(Version, Contrast, Item, sep = "_")
  )
ota2009
# A tibble: 2,338 × 12
   Subject Procedure Version Contrast  Item Condition WordL   WordR   Words.ACC
   <fct>   <chr>     <chr>   <chr>    <dbl> <chr>     <chr>   <chr>       <dbl>
 1 1       TrialProc B2      PB           1 Unrelated HIT     BUNCH           1
 2 1       TrialProc A2      LR           1 Unrelated FALSE   COLLECT         0
 3 1       TrialProc A2      H           19 Unrelated HELLO   BUY             1
 4 1       TrialProc B2      PB          18 Control   BACK    FAT             1
 5 1       TrialProc B1      H            8 Unrelated SALE    SHIP            1
 6 1       TrialProc B1      H           20 Control   HIRE    LISTEN          1
 7 1       TrialProc B2      LR           3 Unrelated ORDER   RAW             1
 8 1       TrialProc A2      PB          13 Control   PART    WIT             1
 9 1       TrialProc A2      LR          13 Control   BEAM    DAY             1
10 1       TrialProc B2      H           13 Control   SERVANT MAZE            1
# ℹ 2,328 more rows
# ℹ 3 more variables: Words.RT <dbl>, RT_log <dbl>, Item_id <chr>

Ota 2009: RTs

Figure 1

Log-normal regression (RTs)

my_seed <- 9283

ota_bm_1 <- brm(
  Words.RT ~ 0 + Condition:Contrast,
  family = lognormal,
  data = ota2009,
  seed = my_seed,
  cores = 4,
  file = "data/cache/ota_bm_1"
)

Log-normal regression: summary

summary(ota_bm_1, prob = 0.9)
 Family: lognormal 
  Links: mu = identity; sigma = identity 
Formula: Words.RT ~ 0 + Condition:Contrast 
   Data: ota2009 (Number of observations: 2338) 
  Draws: 4 chains, each with iter = 2000; warmup = 1000; thin = 1;
         total post-warmup draws = 4000

Regression Coefficients:
                              Estimate Est.Error l-90% CI u-90% CI Rhat
ConditionControl:ContrastH        7.63      0.03     7.58     7.67 1.00
ConditionUnrelated:ContrastH      7.73      0.03     7.69     7.77 1.00
ConditionControl:ContrastLR       7.69      0.03     7.65     7.74 1.00
ConditionUnrelated:ContrastLR     7.75      0.03     7.71     7.80 1.00
ConditionControl:ContrastPB       7.62      0.03     7.58     7.67 1.00
ConditionUnrelated:ContrastPB     7.66      0.03     7.62     7.71 1.00
                              Bulk_ESS Tail_ESS
ConditionControl:ContrastH        6912     3358
ConditionUnrelated:ContrastH      5402     3137
ConditionControl:ContrastLR       5442     2762
ConditionUnrelated:ContrastLR     5660     3092
ConditionControl:ContrastPB       6370     3379
ConditionUnrelated:ContrastPB     6001     3104

Further Distributional Parameters:
      Estimate Est.Error l-90% CI u-90% CI Rhat Bulk_ESS Tail_ESS
sigma     0.54      0.01     0.52     0.55 1.00     5427     3249

Draws were sampled using sampling(NUTS). For each parameter, Bulk_ESS
and Tail_ESS are effective sample size measures, and Rhat is the potential
scale reduction factor on split chains (at convergence, Rhat = 1).

Log-normal regression: expected predictions

conditional_effects(ota_bm_1, effects = "Contrast:Condition")

BUT…

  • Multiple observations from different participants.

  • Multiple observations from different item lists.

  • We need to include varying terms (also known as random or multilevel effects).

  • Regression models with varying terms are variably known as mixed-effects, multilevel, hierarchical, nested… They are all the same thing.

By-subject RTs

By-list RTs

By-subject and by-list varying terms

# took 80 seconds to fit
ota_bm_2 <- brm(
  Words.RT ~ 0 + Condition:Contrast +
    (0 + Condition:Contrast | Subject) +
    (0 + Condition:Contrast | Version),
  family = lognormal,
  data = ota2009,
  seed = my_seed,
  cores = 4,
  file = "data/cache/ota_bm_2"
)

By-subject and by-list model: expected predictions

fixef(ota_bm_2, probs = c(0.05, 0.95))
                              Estimate  Est.Error       Q5      Q95
ConditionControl:ContrastH    7.625015 0.09395207 7.476049 7.770602
ConditionUnrelated:ContrastH  7.723296 0.10391597 7.555802 7.887133
ConditionControl:ContrastLR   7.695946 0.09051165 7.561654 7.835997
ConditionUnrelated:ContrastLR 7.751183 0.07944943 7.622998 7.877910
ConditionControl:ContrastPB   7.620571 0.07357574 7.501065 7.736887
ConditionUnrelated:ContrastPB 7.658061 0.07802223 7.533287 7.783413

By-subject and by-list model: expected predictions plot

conditional_effects(ota_bm_2, "Contrast:Condition")

Difference between unrelated and control

ota_bm_2_draws <- as_draws_df(ota_bm_2, variable = "b_", regex = TRUE)
ota_bm_2_draws
# A draws_df: 1000 iterations, 4 chains, and 6 variables
   b_ConditionControl:ContrastH b_ConditionUnrelated:ContrastH
1                           7.6                            7.7
2                           7.7                            7.7
3                           7.5                            7.7
4                           7.5                            7.7
5                           7.5                            7.6
6                           7.6                            7.6
7                           7.6                            7.5
8                           7.6                            7.7
9                           7.6                            7.7
10                          7.5                            7.7
   b_ConditionControl:ContrastLR b_ConditionUnrelated:ContrastLR
1                            7.6                             7.8
2                            7.7                             7.7
3                            7.6                             7.8
4                            7.6                             7.8
5                            7.6                             7.7
6                            7.6                             7.7
7                            7.6                             7.7
8                            7.7                             7.7
9                            7.7                             7.7
10                           7.6                             7.7
   b_ConditionControl:ContrastPB b_ConditionUnrelated:ContrastPB
1                            7.6                             7.7
2                            7.6                             7.7
3                            7.6                             7.5
4                            7.7                             7.6
5                            7.6                             7.6
6                            7.6                             7.6
7                            7.6                             7.7
8                            7.6                             7.6
9                            7.7                             7.7
10                           7.5                             7.7
# ... with 3990 more draws
# ... hidden reserved variables {'.chain', '.iteration', '.draw'}

Difference between unrelated and control

ota_bm_2_draws <- ota_bm_2_draws |> 
  mutate(
    diff_h = `b_ConditionUnrelated:ContrastH` - `b_ConditionControl:ContrastH`,
    diff_lr = `b_ConditionUnrelated:ContrastLR` - `b_ConditionControl:ContrastLR`,
    diff_pb = `b_ConditionUnrelated:ContrastPB` - `b_ConditionControl:ContrastPB`,
  )
ota_bm_2_draws
# A draws_df: 1000 iterations, 4 chains, and 9 variables
   b_ConditionControl:ContrastH b_ConditionUnrelated:ContrastH
1                           7.6                            7.7
2                           7.7                            7.7
3                           7.5                            7.7
4                           7.5                            7.7
5                           7.5                            7.6
6                           7.6                            7.6
7                           7.6                            7.5
8                           7.6                            7.7
9                           7.6                            7.7
10                          7.5                            7.7
   b_ConditionControl:ContrastLR b_ConditionUnrelated:ContrastLR
1                            7.6                             7.8
2                            7.7                             7.7
3                            7.6                             7.8
4                            7.6                             7.8
5                            7.6                             7.7
6                            7.6                             7.7
7                            7.6                             7.7
8                            7.7                             7.7
9                            7.7                             7.7
10                           7.6                             7.7
   b_ConditionControl:ContrastPB b_ConditionUnrelated:ContrastPB diff_h
1                            7.6                             7.7  0.105
2                            7.6                             7.7  0.036
3                            7.6                             7.5  0.224
4                            7.7                             7.6  0.147
5                            7.6                             7.6  0.067
6                            7.6                             7.6  0.033
7                            7.6                             7.7 -0.053
8                            7.6                             7.6  0.071
9                            7.7                             7.7  0.141
10                           7.5                             7.7  0.155
    diff_lr
1   0.11971
2   0.00021
3   0.14216
4   0.13556
5   0.06029
6   0.10575
7   0.10938
8  -0.01188
9  -0.00317
10  0.03514
# ... with 3990 more draws, and 1 more variables
# ... hidden reserved variables {'.chain', '.iteration', '.draw'}

Difference between unrelated and control: plot

Difference between unrelated and control: CrIs

ota_bm_2_draws |> 
  pivot_longer(diff_h:diff_pb) |> 
  select(name, value) |> 
  group_by(name) |> 
  summarise_draws(~quantile(.x, probs = c(0.05, 0.95))) |> 
  mutate(
    across(where(is.numeric), ~round(.x, digits = 2))
  )
# A tibble: 3 × 4
# Groups:   name [3]
  name    variable  `5%` `95%`
  <chr>   <chr>    <dbl> <dbl>
1 diff_h  value    -0.08  0.28
2 diff_lr value    -0.11  0.2 
3 diff_pb value    -0.08  0.15

Difference of difference LR/H

ota_bm_2_draws <- ota_bm_2_draws |> 
  mutate(diff_lr_h = diff_lr - diff_h)

ota_bm_2_draws |> 
  ggplot(aes(diff_lr_h)) +
  geom_vline(xintercept = 0) +
  stat_halfeye()

Difference of difference: CrIs

ota_bm_2_draws |> 
  select(diff_lr_h) |> 
  summarise_draws(~quantile(.x, probs = c(0.05, 0.95))) |> 
  mutate(
    across(where(is.numeric), ~round(.x, digits = 2))
  )
# A tibble: 1 × 3
  variable   `5%` `95%`
  <chr>     <dbl> <dbl>
1 diff_lr_h -0.27  0.18

Results overview

H1. The difference in RTs between unrelated and control is the same in homophones (H) and near-homophones (LR).

  • Not enough evidence to assess (CrI [-0.27, 0.18]).

H2. There is no difference in RTs in minimal pairs (PB).

  • Not enough evidence to assess (CrI [-0.08, 0.15]).

Summary

  • You should include varying terms if data is “hierarchical”, for example repeated measures from subjects or items.

  • Not including varying terms (wrongly) inflates posterior certainty.

  • Frequentist regression models with lme4 often don’t converge and researchers simplify the hierarchical structure of the model.