Wrangling data with R
1 Data wrangling
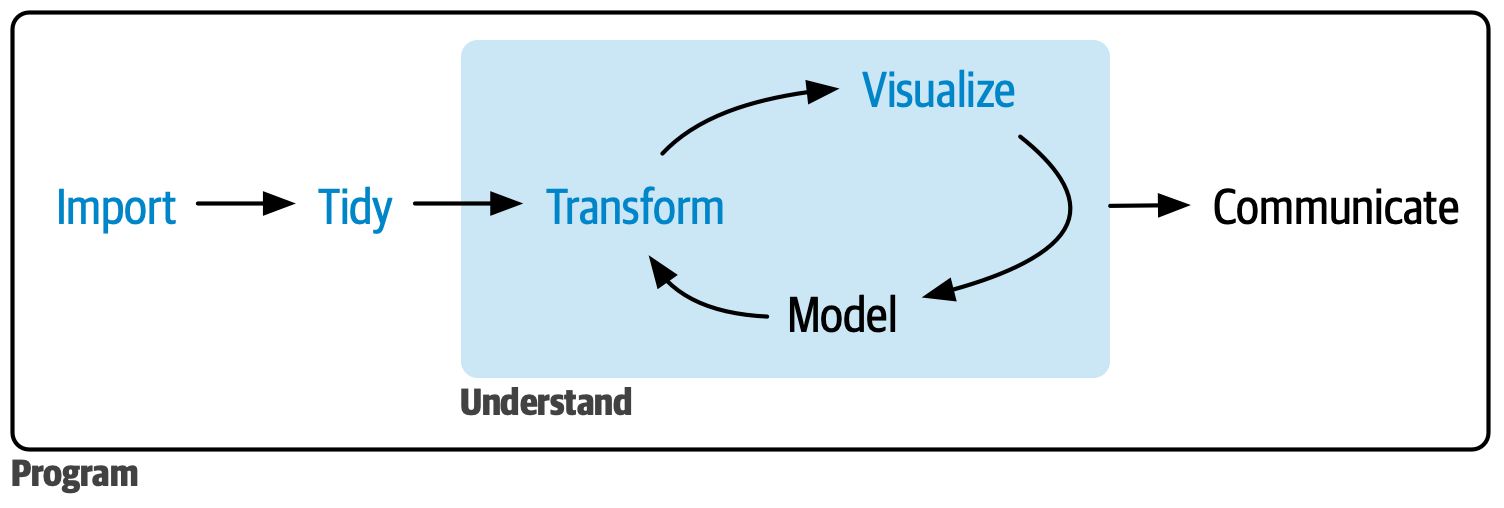
Data wrangling encompasses three main steps in the R pipeline:
Tidying data.
Transforming data.
2 Tidying data
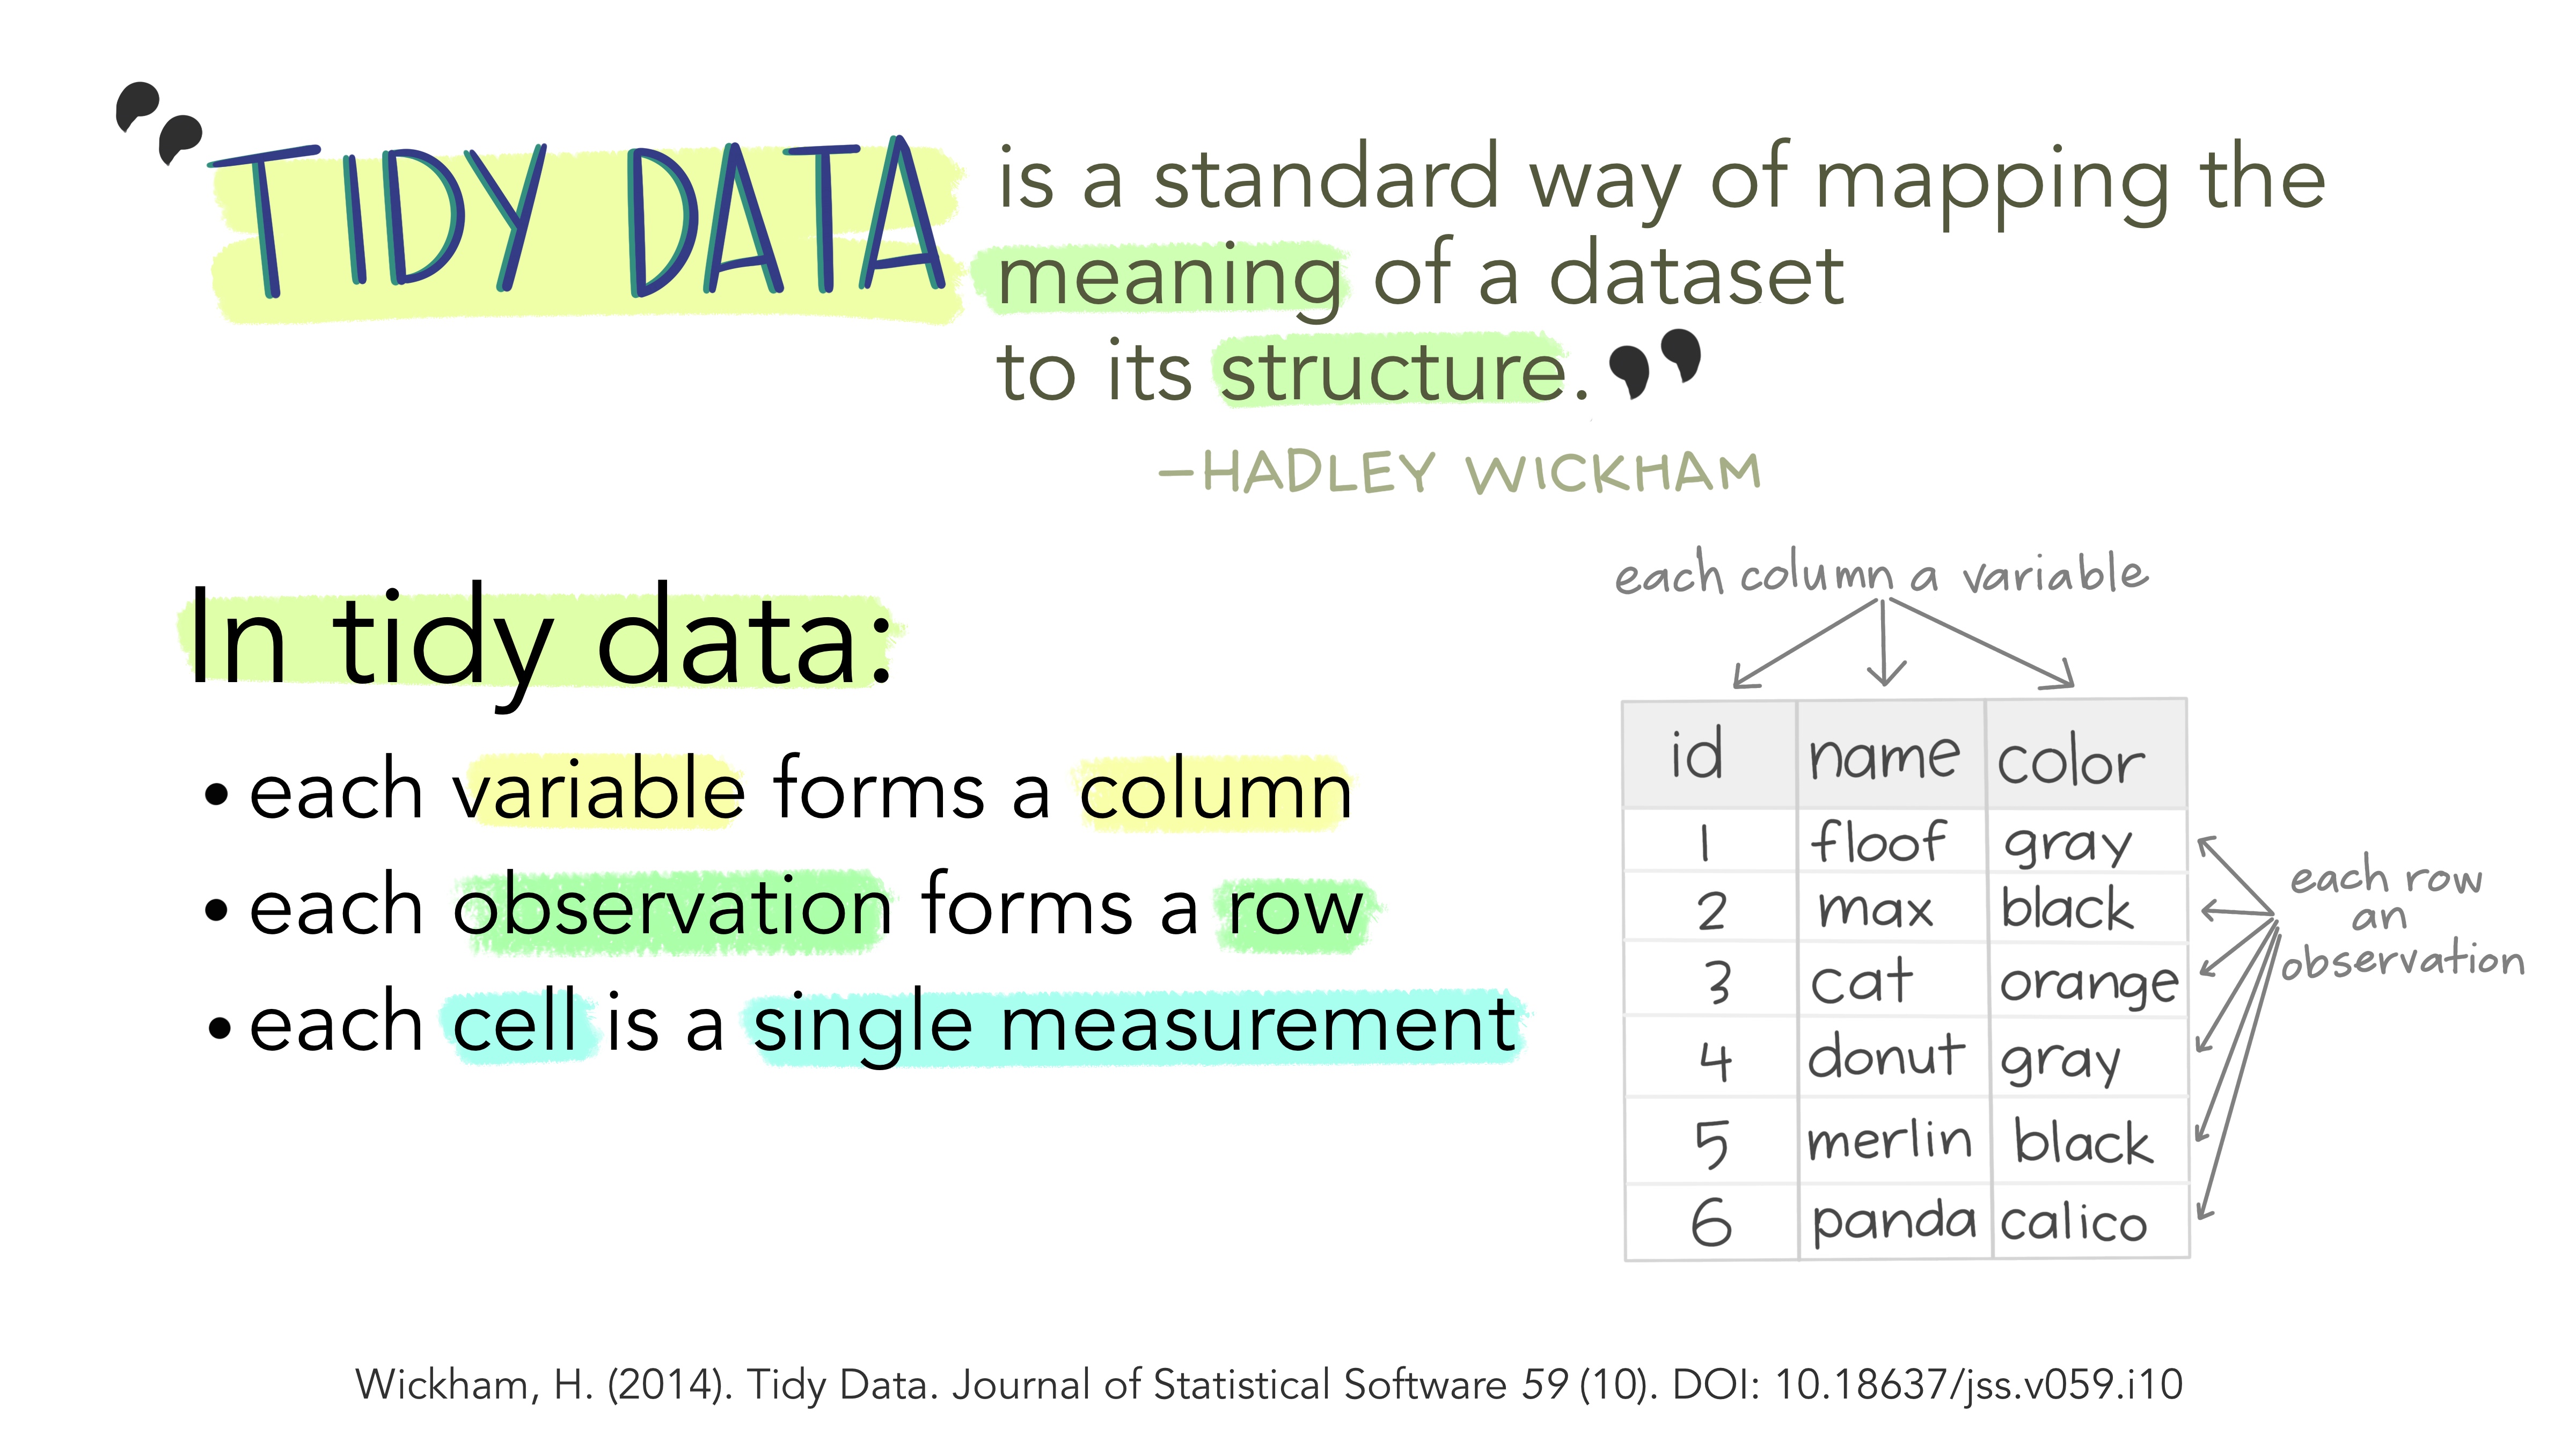
Data tidying is about reshaping the data so that they are in a tidy format.
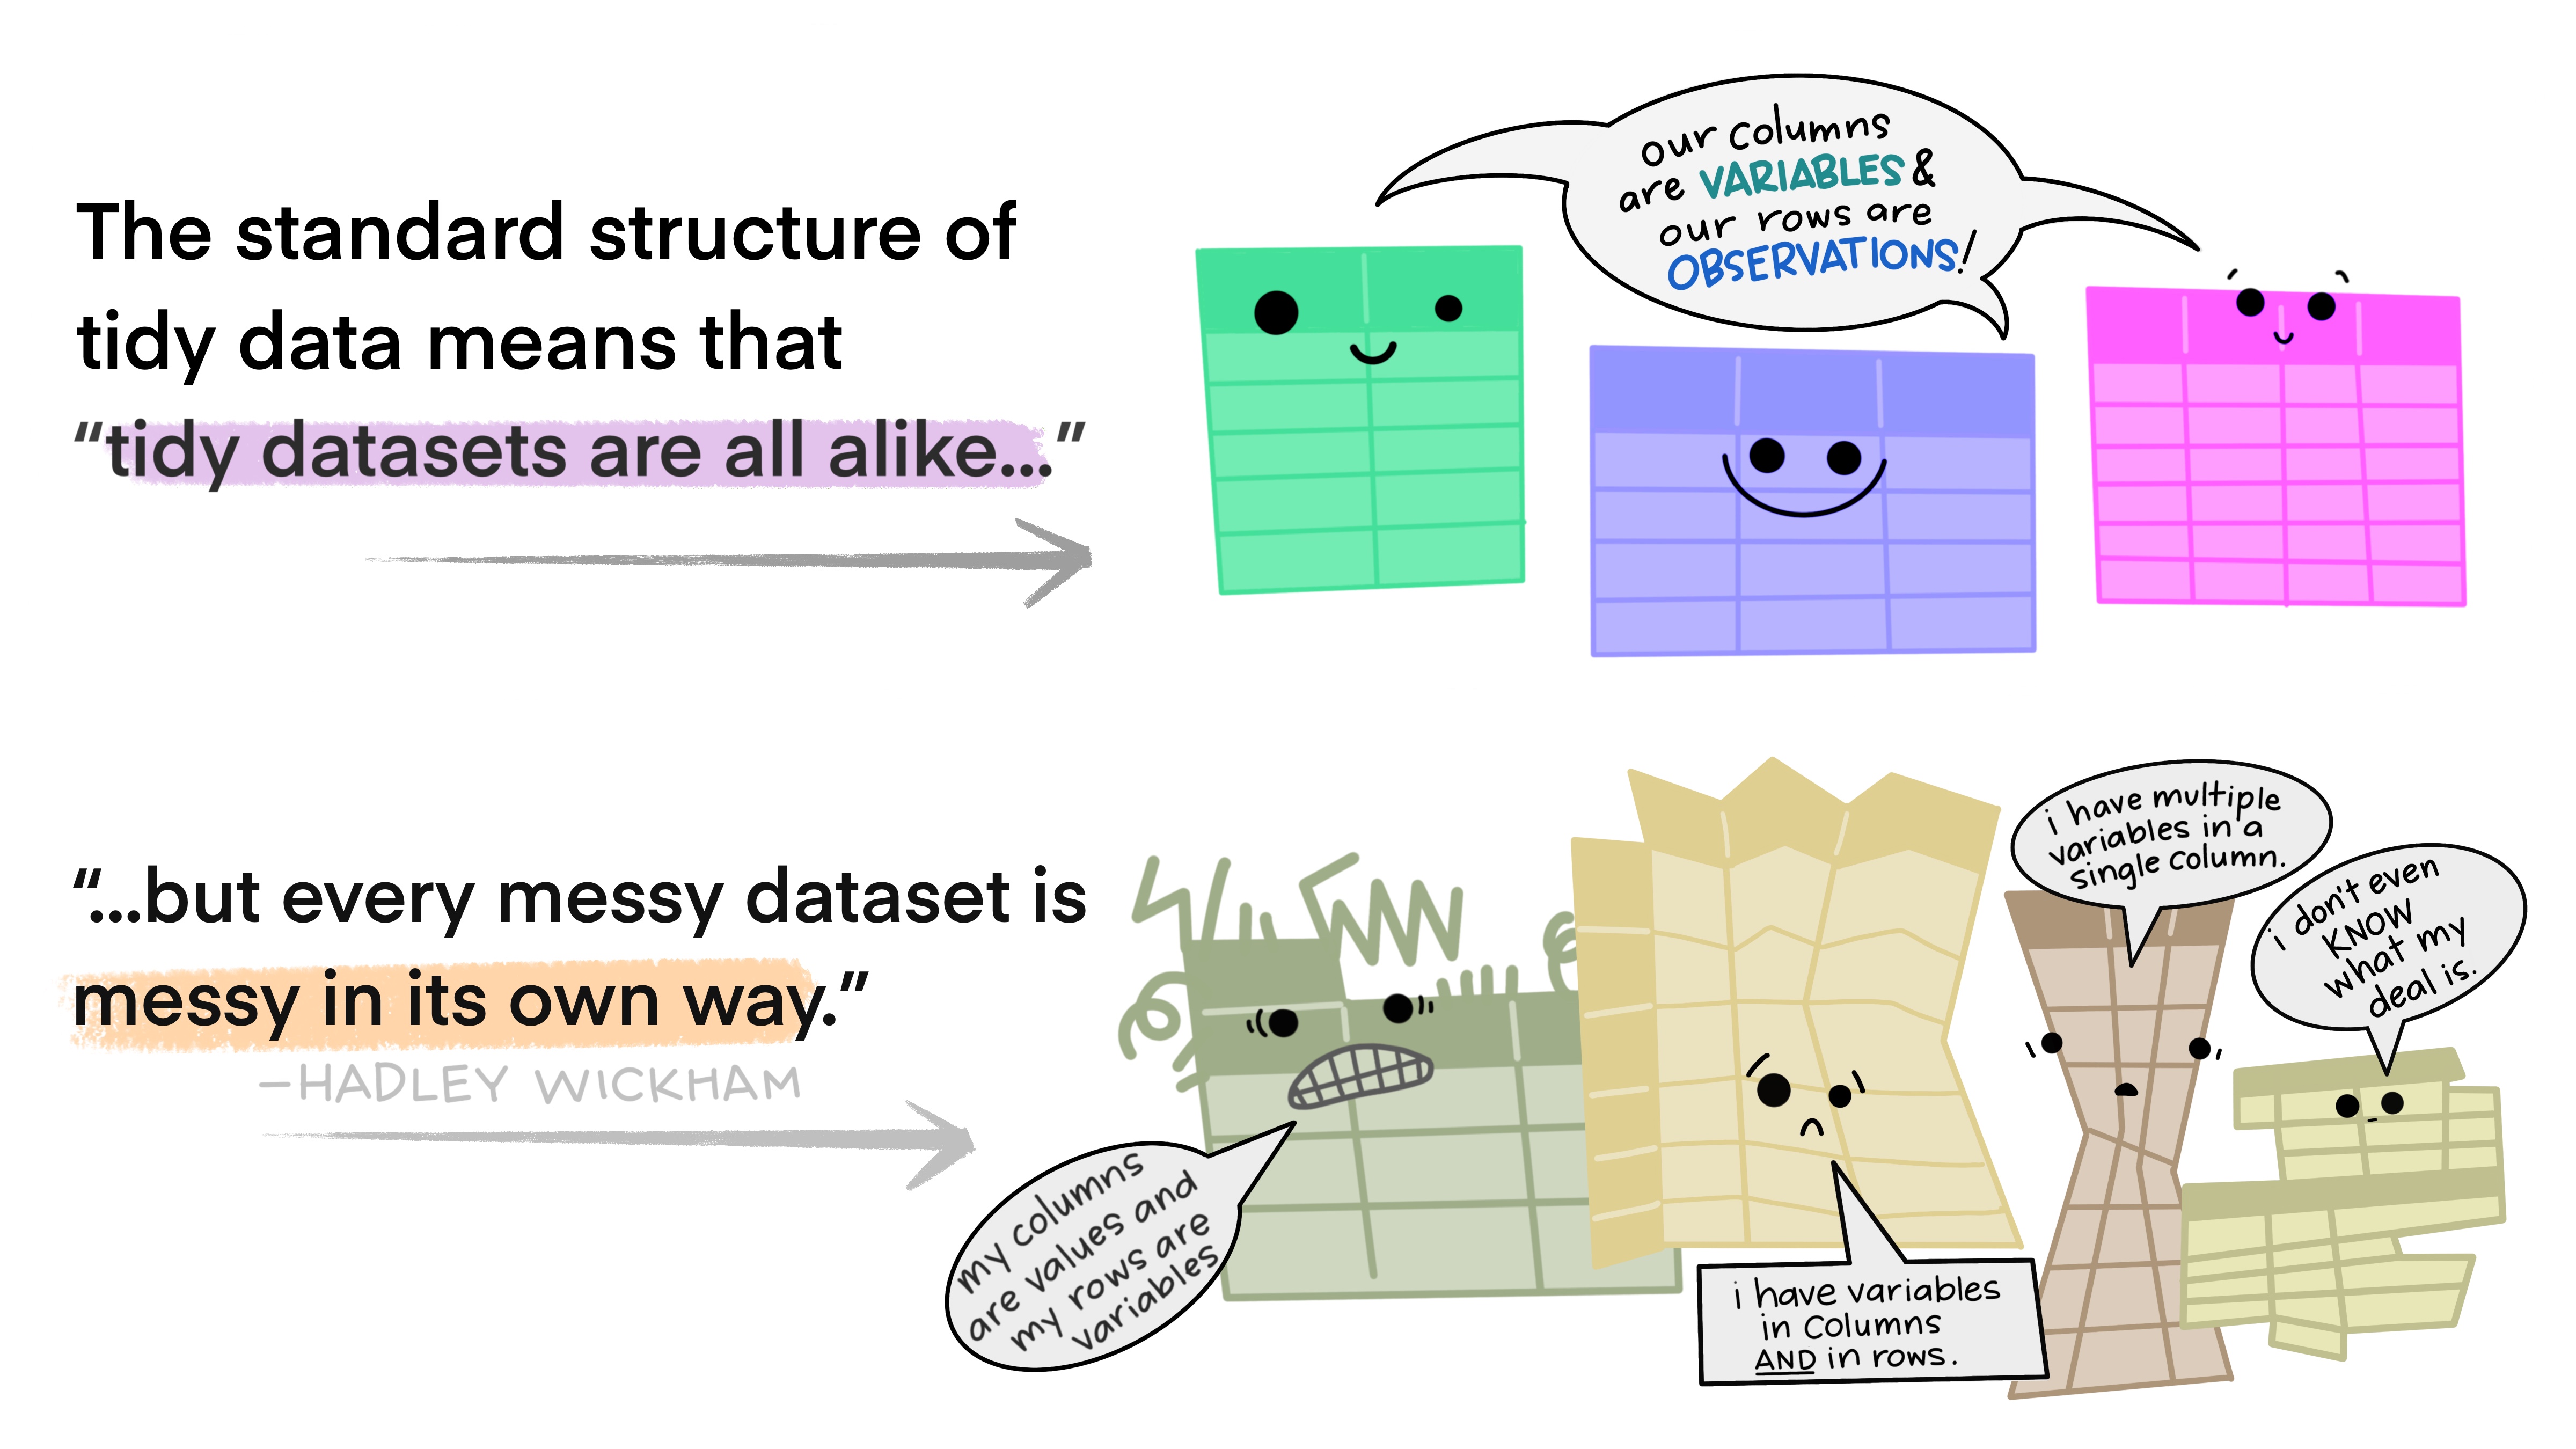
The concept of tidy data was introduced by Wickham 2014. The following illustrations by Allison Horst explain what it is meant with tidy data.
I recommend that if you have control over the layout of tabular data you use a tidy format (columns are variables and rows are observations). However, we sometimes have to use pre-existing data which might be messy or we need to modify our own tidy data for specific purposes (like making a plot that requires a different layout).
The nice thing about tidy data is that once they are tidy you can reshape them easily in whichever way you want.
The tidyverse package tidyr allows users to tidy up messy data with several functions. (It’s called the “tidyverse” because all packages are designed to work with tidy data!).
The most important procedure for tidying up data is pivoting. You can learn more about pivoting in Pivoting.
3 Transforming data
Transforming data encompasses several operations, each of which can be achieved with specific tidyverse functions.
You can filter data based on specific columns and criteria with
filter().Mutate columns or create new ones based on existing columns with
mutate().To summarise data use the
summarise()function.It is also possible to join data using the mutating join functions. See Joins of the R for Data Science book.


